We can’t say with certainty where the market goes from here – whether the market will turn around in January or continue into bear territory – and neither can anyone else. What we can say for certain however is that big up days like we saw today (SPY +3.35%) are not an indicator that this market is out of the woods. Contrary to conventional wisdom, big up days occur with more frequency in bear markets than bull markets.
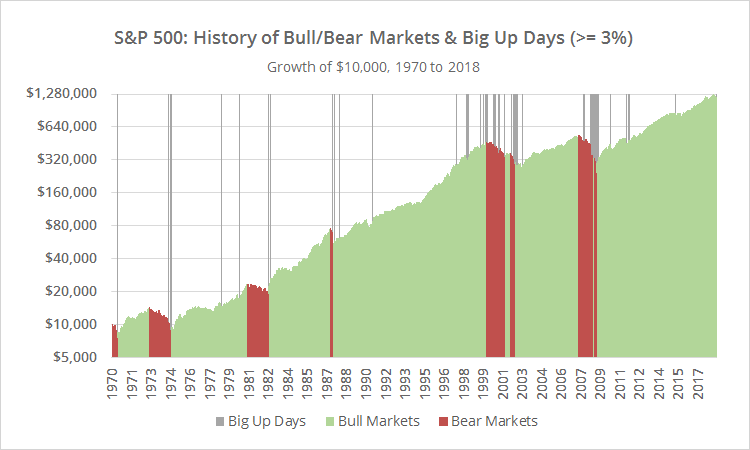
To illustrate, the graph below shows a history of bull/bear markets (+/- 20%) and big up days (>= 3%) for the S&P 500 since 1970. Bull/bear markets are measured peak-to-trough, which you could only know in hindsight, but that’s okay. The point here isn’t to predict market regimes, but rather, to understand market dynamics when we’re in those regimes (even if we don’t realize it yet).
Observations:
- Since 1970, the S&P 500 has spent about 14% of all days in a bear market, and 86% of days in a bull market. We don’t know yet whether we’re in the beginnings of a bear market now.
- Up days in the neighborhood of what we saw today (>= 3%) have occurred 105 times, or a little more than twice per year.
- About two-thirds of those big up days (65.7%) have occurred during bull markets. In this sense, big up days have occurred more often during bull markets, but that makes sense – bull markets are far more common.
- On any given day however, it’s much more likely during bear markets to have a big up day – more than 3x as likely in fact than during bull markets (1). Bear markets bring volatility and volatility tends to cut both ways (up and down).
Is this an indicator that the recent market weakness continues? Not at all. But it does mean that today, in and of itself, wasn’t an indicator of a market turnaround.
New here?
We invite you to become a member for about a $1 a day, or take our platform for a test drive with a free limited membership. Put the industry’s best tactical asset allocation strategies to the test, combine them into your own custom portfolio, and then track them in near real-time. Have questions? Learn more about what we do, check out our FAQs or contact us.

(1) Calculation: [(14.48% / 34.29%) / (85.52% / 65.71%)]