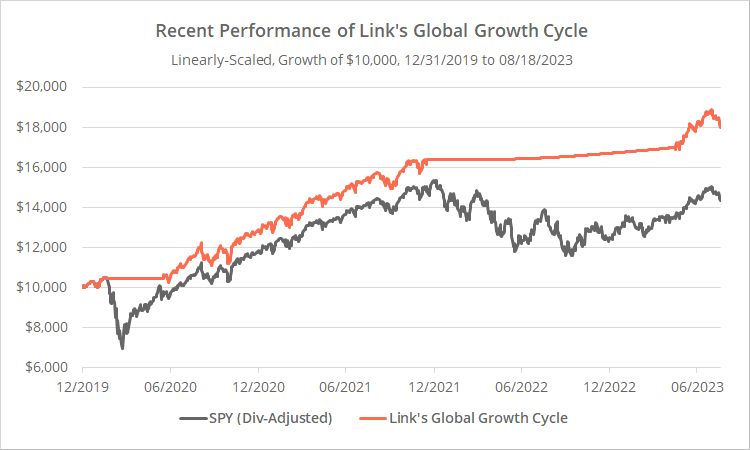
We’ve previously covered Link’s Global Growth Cycle strategy, which uses OECD Composite Leading Indicator (CLI) data to time the market. The strategy has navigated the market gyrations over the last few years well, so naturally it’s gotten the attention of members.
Recent strategy results follow. Learn about what we do and follow 70+ asset allocation strategies like this one in near real-time.
Historical CLI data is often revised in its entirety (by design), and the thrust of our original analysis was showing the impact of those revisions on strategy performance. We tested using “vintage” CLI data, i.e. as close to what was available in real-time as possible. In summary, the strategy was still effective, just not as effective as the author’s original test would indicate.
One thing we couldn’t test was the impact of countries being added/removed from the CLI over time; we used the constituent countries at the time of our test. As it turns out, early this year OECD did a major overhaul of the CLI, removing 25 (mostly European) countries, plus Russia (for obvious reasons), leaving just 17 countries in the index.
In this post we’ll reanalyze the Global Growth Cycle strategy to understand how this new, greatly streamlined CLI index would have affected strategy performance.
Strategy rules tested (a quick refresher):
CLI data for a given month is released after month-end. To compensate for that, this strategy trades on the 15th calendar day of each month. That delay is overly generous, but it allows backtesting very distant data with confidence that the CLI data would have been released prior to trade execution.
- On the 15th calendar day of each month (or first trading day thereafter), calculate a “Diffusion Index” based on CLI data from the previous month. The Diffusion Index measures the % of countries whose CLI value rose month-over-month. Absolute CLI values don’t matter.
- If our Diffusion Index value is >= 50%, go long SPY (S&P 500) at the close, otherwise move to cash. Hold the position until the 15th calendar day (or first trading day thereafter) of the following month.
This is a very simple strategy. Any timing benefit is in the strength of the CLI data itself, rather than an attempt by the strategy to massage the data.
Testing with old 43 country vs new 17 country CLI data:
Geek note: All of the CLI data used in the tests below is based on the earliest “vintage” of data available. While still imperfect for reasons we discussed in our previous post, it’s a much truer representation of how the strategy would have performed if traded in real-time.
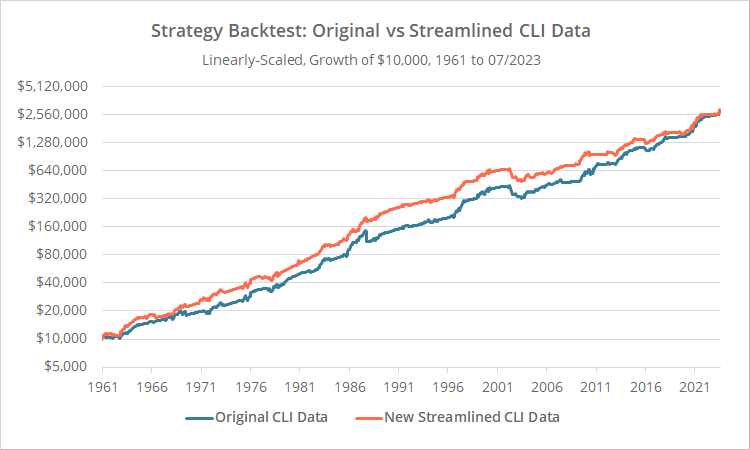
In the graph below we show our original test of the strategy using the old 43 country CLI (blue) versus an updated test based on the new 17 country CLI (orange). Results are net of transaction costs, and return on cash is assumed to equal the 3-month US T-Bill rate – see backtest assumptions.

Logarithmically-scaled. Click for linearly-scaled chart.
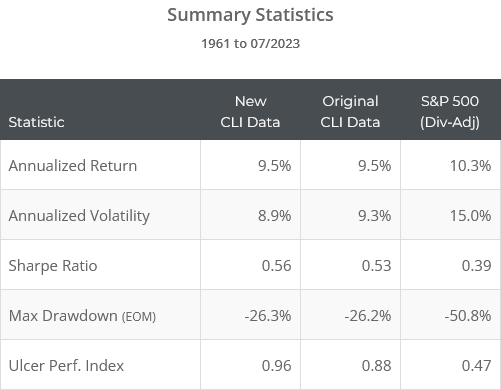
We’ve also included the S&P 500 (SPY) in the stats below to demonstrate the success of the strategy in controlling drawdowns and excessive volatility, while maintaining the meat of S&P 500 returns.
The old and new CLI indexes are very different in terms of constituent countries, and our tests of the two only agree on the direction of the market about 83% of the time. Despite that, the overall performance of the strategy would have been largely unaffected over the long-term.
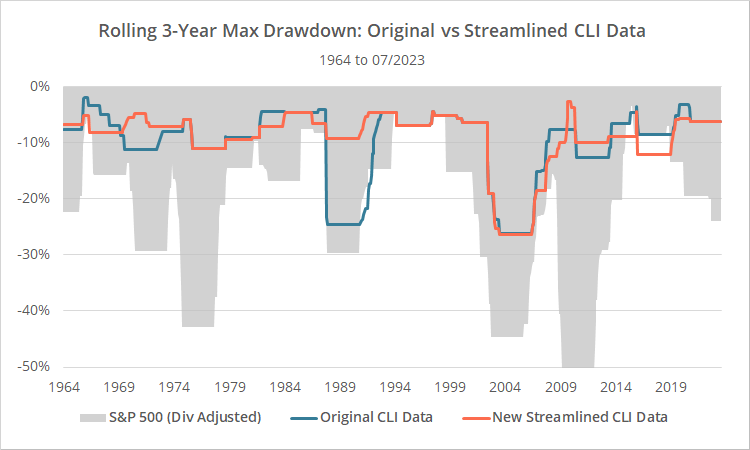
That big drawdown in October 1987 disappears using the new data, but given the unique nature of that event, I don’t think it says anything about the strategy other than it got lucky in the new test (or unlucky in the original).
Our conclusion:
Whatever your take on the strategy was in our original test (good or bad), that should be unaffected by the changes to the CLI index. It’s still essentially the same strategy, taking advantage of the same basic market observation.
The strategy’s position could be different in any given month, and that could lead to a very different result in the short-term (October, 1987 being the best example), but over the long-term we don’t expect a consistent positive or negative impact.
New here?
We invite you to become a member for about a $1 a day, or take our platform for a test drive with a free membership. Put the industry’s best Tactical Asset Allocation strategies to the test, combine them into your own custom portfolio, and follow them in real-time. Learn more about what we do.


