In this post we model retirement Safe Withdrawal Rates (SWR) and Perpetual Withdrawal Rates (PWR) for a large collection of tactical and buy & hold strategies. We track 50+ tactical strategies, allowing us to draw some broad conclusions about TAA as a trading style. Learn more about what we do.
Members: This post only includes summary data. For per-strategy results, please see the members area.
What are safe and perpetual withdrawal rates (SWR/PWR)?
- SWR measures the maximum amount that could have been withdrawn from a portfolio each year in retirement (with an annual adjustment for inflation) without running out of money over the worst retirement period. It’s the source of the well-known “4% rule” common in financial planning.
- PWR is a more conservative measure. Here the goal is to preserve the entire initial inflation-adjusted portfolio (rather than just not running out of money). Conceptually, it’s the amount that could be drawn from a portfolio in perpetuity.
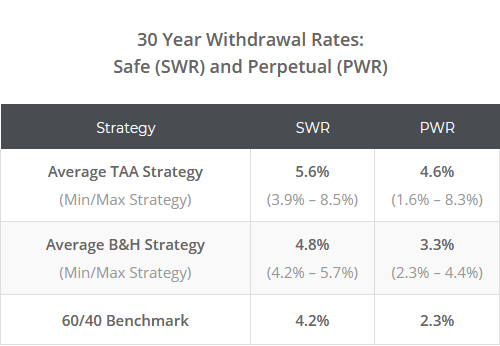
In this post we focus on a 30-year retirement. Later we’ll talk more about how these results were calculated. For now, let’s focus on the results, starting with a high-level summary:
How to read these results: The withdrawal rate shown is a percentage of the starting portfolio size, with an annual adjustment for inflation. Let’s look at an example using the average TAA strategy’s SWR of 5.6%, a starting portfolio value of $1m, and for simplicity’s sake, constant inflation of 2% per year (in actuality, we use actual historical CPI).
At the beginning of year 1 of retirement, $56,000 is withdrawn ($1m * 5.6%). At the beginning of year 2, that increases to $57,120 ($56k * 1.02). In year 3, it increases to $58,262 ($56k * 1.022), etc. Put another way, purchasing power remains constant throughout retirement, and is unaffected by the performance of the portfolio.
Broadly speaking, withdrawal rates have been higher for tactical strategies than buy & hold, allowing for a larger withdrawal each year. Why? Tactical strategies have done a better job managing losses relative to return. That means that worst-case retirement periods have not been as bad as they have with B&H. This is yet another advantage of smoother, more consistent investment performance.
Drilling Down: Safe Withdrawal Rates (SWR)
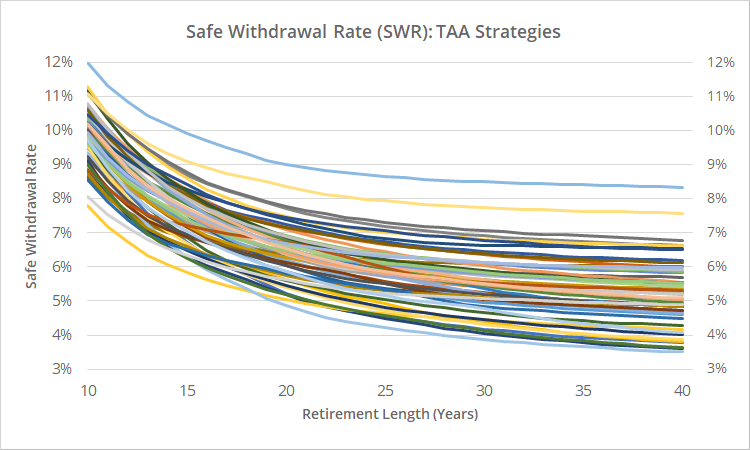
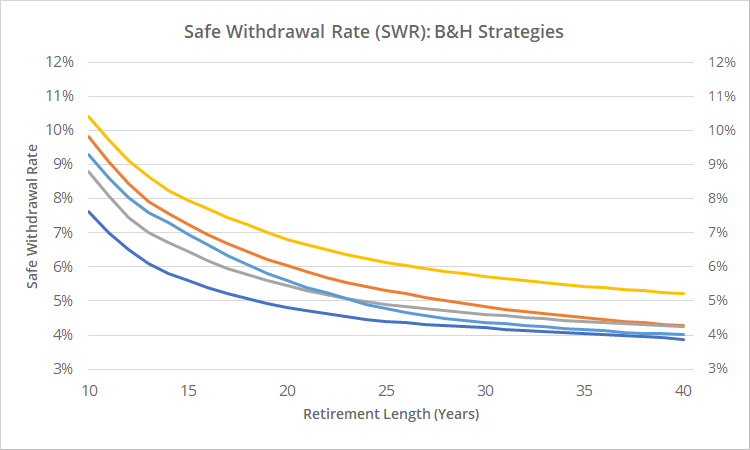
In the charts below, we show the SWR for 50+ individual tactical strategies (first chart) and a handful of popular buy & hold strategies like the Permanent Portfolio (second chart), based on the length of retirement.
Members: To unlock the identity of each of these strategies, please see the members area.
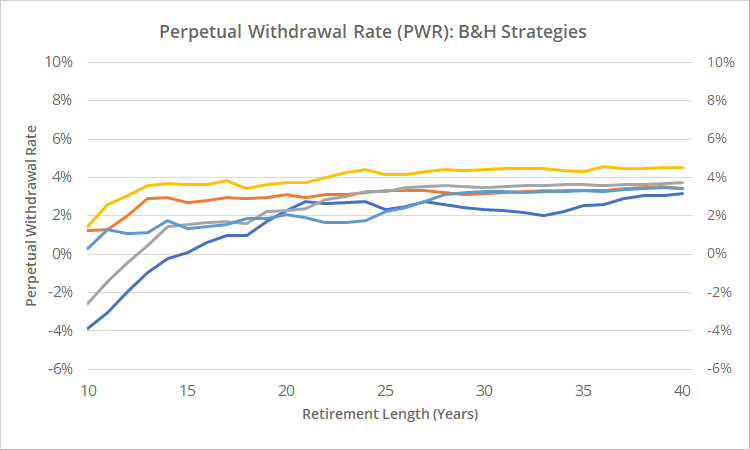
Note the much wider disparity in SWRs for tactical strategies (above) than buy & hold strategies (below). That’s because there’s a lot more variety among TAA strategies in terms of how aggressively they attempt to generate return vs managing losses. B&H has less tools in the toolbox, so results tend to be more similar.
We recognize that we didn’t include a ton of buy & hold strategies in this analysis. Comparing tactical vs B&H wasn’t originally a focus when we put together the data for this post, so we only included the handful of B&H strategies that we track on this site. Having said that, based on our previous analysis over at our sister site BetterBuyAndHold, we would expect other popular B&H strategies to fall close to the range of withdrawal rates shown here.
Drilling Down: Perpetual Withdrawal Rates (PWR)
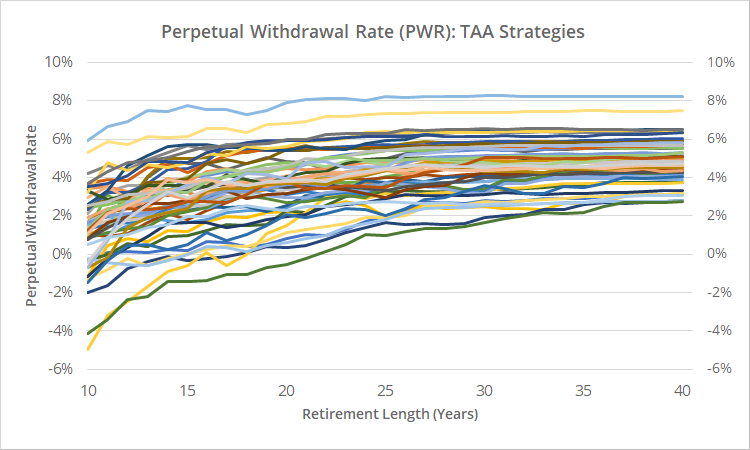
Unlike SWR, PWR charts are upward sloping and “lumpy”. That’s because the goal at each retirement length is to not lose any of the original inflation-adjusted portfolio. It becomes easier to meet that strict criteria in the worst-case scenario (thus raising the PWR) as the length of retirement grows.
Same basic story as we saw with SWR. PWR tends to be higher overall for tactical, but there is also a much broader range of results due to a more diverse array of strategies.
How well will these historical results reflect the actual future?
First, a note of common sense: withdrawal rate analysis, like all investment analysis, involves a degree of uncertainty. The future is guaranteed to be different, and actual withdrawal rates could be significantly higher or lower than what is presented here. That means that it would be reckless to take the values presented here as gospel and plan for retirement as if they were chiseled in stone. When it comes to financial planning, investors should always err on the side of caution.
In the case of buy & hold, we know that the withdrawal rates shown here are likely overly optimistic, because they’re largely based on an era of falling interest rates. It’s a mathematical certainty that treasuries and other highly rate sensitive assets (which are a significant component of B&H) will fail to perform in the long-term future as well as they have over the last four decades. We’ve written a lot about this subject at our sister site BetterBuyAndHold (read more and more).
In the case of tactical asset allocation, it’s less clear how well these SWR/PWR results will match the actual future. An era of sideways/rising rates could have much less of an impact on TAA because, unlike buy & hold, TAA has the ability to reduce exposure to underperforming assets (read more).
Put another way, recall our past discussion about strategy vs asset risk. Buy & hold carries a lot of “asset risk”, and we know a significant portion of those assets will underperform historical norms. TAA carries more “strategy risk” (mostly in the form of momentum/trend-following) and only time will tell how well investors are compensated for that risk in the coming decades.
How these results were calculated:
To calculate SWR, we use the approach described by William Bengen in his paper Determining Withdrawal Rates Using Historical Data. To calculate PWR, we use the approach described by Portfolio Charts (an excellent site that is to buy & hold what Allocate Smartly is to TAA).
We run separate simulations starting on each month in the strategy backtest. When insufficient data exists to project forward n years, we “loop around” to the start of the sample, maintaining the sequence of returns. For a strategy that begins in 1970, that would result in 600+ unique sequences. Both SWR and PWR are based on the absolute worst case among those.
Note: The strategy backtests that this analysis is based on vary widely in length. Many go as far back as 1970, but others are much shorter. For strategies with particularly short backtests, these results should be viewed with an extra dose of skepticism. The fact that SWR/PWR uses the absolute worst period in the sample means that more data can only lower the rate, never increase it. That means longer backtests make for more conservative (and likely more accurate) estimates of SWR/PWR.
Improving on these results:
There is a wide disparity in results among individual strategies (members can find individual strategy results here), so the strategies traded matter…a lot. Broadly speaking, tactical strategies have enjoyed higher withdrawal rates, sometimes significantly so.
These results could be further improved by combining multiple strategies together (a challenge our site was specifically built to tackle). By combining strategies, we tend to reduce the potential for significant short-term loss because we diversify the short-term “strategy risk” of any one particular strategy. By decreasing short-term losses relative to long-term returns, we increase withdrawal rates.
New here?
We invite you to become a member for about a $1 a day, or take our platform for a test drive with a free limited membership. Put the industry’s best tactical asset allocation strategies to the test, combine them into your own custom portfolio, and follow them in near real-time. Not a DIY investor? There’s also a managed solution. Learn more about what we do.
