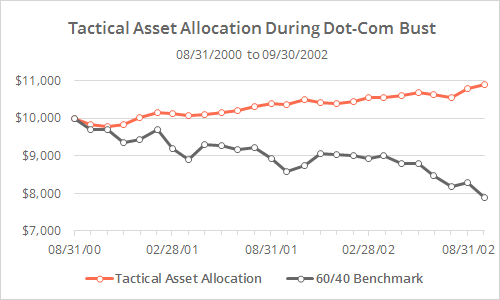
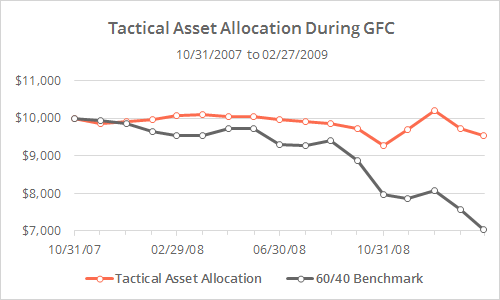
Most Tactical Asset Allocation (TAA) strategies have followed the same basic storyline. They keep pace with the market during the good times (like we find ourselves in right now), and shine during the bad times. To illustrate, the graphs below shows the average return of all of the TAA models that we track (orange) versus the 60/40 benchmark (grey) during the Dot-Com Bust of 2000-02 and Global Financial Crisis of 2007-09. Click to zoom.
During the Dot-Com Bust, the 60/40 benchmark lost -21% while TAA gained 9%, and during the Global Financial Crisis, the benchmark lost -29% while TAA pared that down to just a -5% loss.
While we don’t (yet) track every published tactical asset allocation model, the 31 strategies that we do track are broadly representative of the TAA space, and I think it’s fair to draw some broader conclusions from our data. In this post we look at the allocation changes that these models made through each crisis to better understand how they weathered the storm so well.
But first, a little perspective.
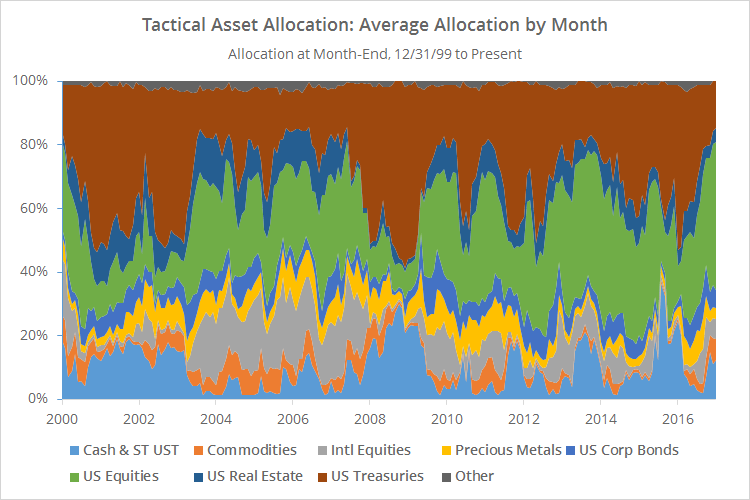
The primary advantage of TAA over traditional asset allocation is the ability to adjust allocation according to market conditions. The graph below shows the average allocation of the TAA strategies that we track at the end of every month since the turn of the century. To make this data easier to digest, we’ve grouped assets into nine broad categories.
Allocation has varied widely. For example, US equities have ranged from a low of 7% to a high of 47% (where they just so happen to sit as I write this), US Treasuries from 12% to 57%, and cash from 1% to 37%.
In the graph above you see multiple periods of rapid compression in risk assets, particularly around 2000-02 (Dot-Com Bust) and 2007-09 (GFC). In the data below, we zoom in on these two periods.
Dot-Com Bust
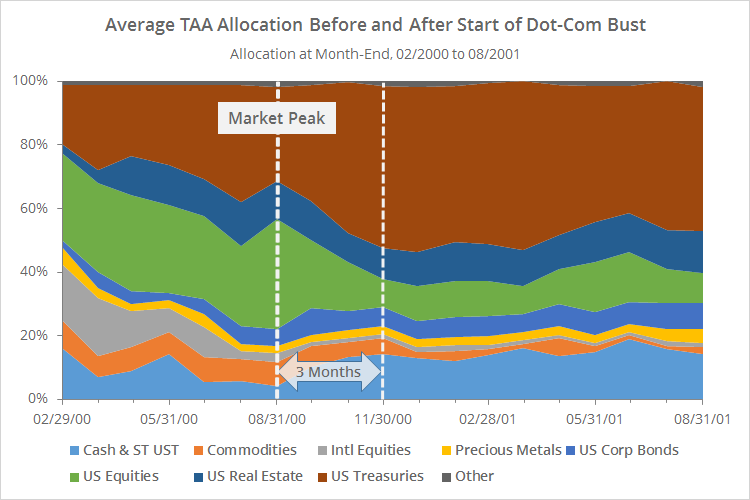
Here we have the average TAA allocation in the 6 months before the market peak (08/31/00), and the 12 months after. Note the rapid reduction in risk assets.
Key observations:
- For the most part, TAA did not foresee the impending crisis before it began. Besides a sharp reduction in international equities, TAA did not make significant moves prior to the market peak. Having said that, TAA was fairly well diversified at that point.
- Once the market slide began, TAA moved quickly to reduce allocation to vulnerable assets. Within 3 months, exposure to US equities fell from 35% to just 9%, and Treasuries/cash rose from 34% to 65%.
- It was this diversified portfolio at the onset of the bust, and the rapid move to de-risk the portfolio immediately after, that led to TAA’s success during the Dot-Com Bust.
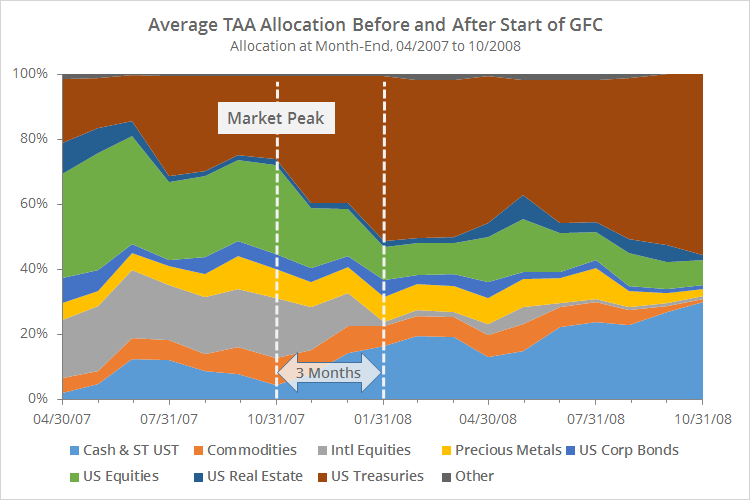
Global Financial Crisis
Here we have the same chart for the Global Financial Crisis, showing the average TAA allocation in the 6 months before the market peak (10/31/07), and the 12 months after.
The key observations here are almost identical as we found in the previous crisis:
- TAA did not de-risk prior to the market peak, with the exception of selling almost all US real estate exposure. That was important as US real estate suffered severe losses during the GFC. Generally-speaking, TAA was less diversified at the onset of the GFC than the Dot-Com Bust.
- Within 3 months after the GFC began, TAA significantly reduced allocation to risk assets. Exposure to US/international equities fell from 46% to 11%, and Treasuries/cash rose from 30% to 67%.
- Although TAA wasn’t as well diversified at the onset of the crisis as it was during the Dot-Com Bust, it was able to mitigate losses by quickly de-risking the portfolio.
How prepared is TAA for the next crisis?
There is (always) significant opportunity for another crisis on the horizon for global markets. TAA has shined in the past during these rough periods, but the past is not always prologue and every crisis is different.
Some thoughts about the next market crisis:
- Earlier we showed a graph of the average TAA allocation since the turn of the century. As the graph shows, TAA is now bumping up against previous record highs for exposure to risk assets like US equities. The graph also shows that’s not out of the ordinary and we’ve been here many times before, but if a crisis were to begin today there would be early losses as TAA adjusted. Having said that, most previous market crises have been preceded by a lukewarm market, meaning TAA would likely be less aggressively positioned than it is today.
- During previous crises, it took about 3-months for TAA to de-risk. Some delay is necessary. Too much delay and the portfolio is too slow to respond. Too little delay and TAA would be more prone to whipsaws as we saw in 2015-16.
- During previous crises, TAA made heavy use of US Treasuries as a defensive asset. That of course is a concern if we enter a new extended period of rising interest rates, when US Treasury performance would suffer. If that were the case, my expectation is that TAA would make greater use of cash. A number of the strategies that we track are built to rotate into shorter duration instruments like cash when longer duration Treasuries are weak (ex. Generalized Protective Momentum and PAA-CPR). Learn more.
In summary:
TAA is running hot at the moment, but we’ve been here many times before. If there’s a crisis, there will be a delay in responding to it by design, so expect an adjustment period. In past crises, the most significant de-risking occurred over the first three months. The next crisis will likely make heavier use of shorter duration instruments like cash instead of longer duration Treasuries. And if the past is any indication, TAA will be far better suited to respond to the next crisis than a traditional buy and hold approach.
We invite you to become a member for less than $1 a day, or take our platform for a test drive with a free limited membership. We track the industry’s best tactical asset allocation strategies in near real-time, and combine them into custom portfolios. Have questions? Learn more about what we do, check out our FAQs or contact us.
