This is a summary of the recent performance of a number of excellent tactical asset allocation strategies. These strategies are sourced from books, academic papers, and other publications. While we don’t (yet) include every published TAA model, these strategies are broadly representative of the TAA space. Read more about our backtests or let AllocateSmartly help you follow these strategies in near real-time.
Commentary:
Tactical asset allocation ended the year strong as a result of a fairly aggressive allocation to start the month, coupled with a solid performance from a number of significant risk asset classes. Notable winners included: US and international equities (ex. SPY +2.0% and EFA +1.7%), real estate (VNQ 2.7%), and commodities (DBC +4.1%). Notable losers included: US Treasuries (ex. TLT -0.7%), emerging markets (EEM -1.4%) and gold (GLD -1.9%).
All in all, it was a middling year for TAA. Most of the strategies that we track employ some flavor of momentum and/or trend-following, both of which struggled this year, making simple equity-heavy allocations like the 60/40 benchmark tough to beat. Such is the ebb and flow of active trading. There are some real headwinds on the horizon for buy & hold (equity valuations and rising interest rates being the most noteworthy), and it will be interesting to see how tactical asset allocation weathers those storms. Historically, TAA has shined most brightly during times of market stress.
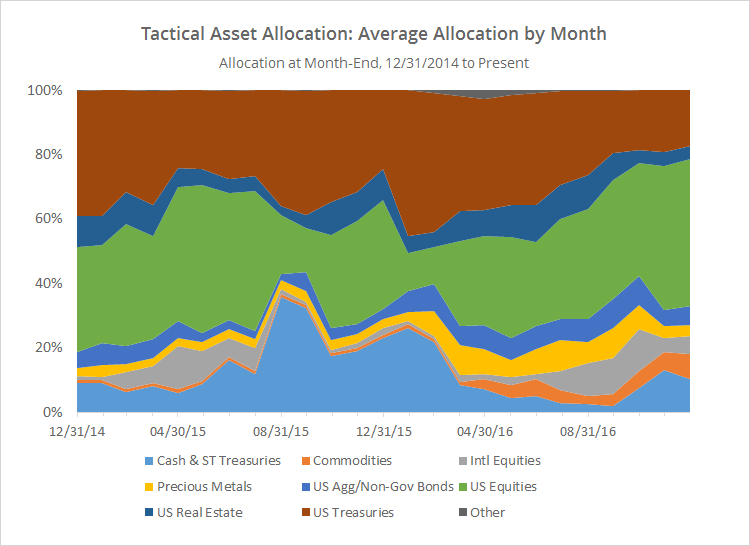
Entering into the new year, the strategies that we track remain largely in risk on mode. To illustrate, the chart below shows the average allocation to broad categories of assets by the 29 strategies that we track, as of the end of each month since EO’2014. Note that allocation to US equities (green) is bumping up against a sample high of 46%. In other words, on average, the strategies that we track are currently nearly half allocated to some flavor of US equities. Conversely, allocation to US Treasuries is at a sample low of 17%.
All in all however, the overall exposure to risk on/risk off assets has remained essentially the same over the last five months. Below I’ve combined asset classes into even broader categories: “risk on” (equities, real estate and high yield bonds) versus “risk off” (everything else). I realize that some asset classes don’t fit neatly into these buckets, but it makes for a useful high level view.
As previously mentioned, while we don’t (yet) track every published tactical asset allocation model, the 29 strategies that we do track are broadly representative of the TAA space, and I think it’s fair to draw some broader conclusions from this data. Tactical asset allocation overall remains bullish on risk, but there is significant exposure to investors here if the market starts the new year weak.
We invite you to become a member for less than $1 a day to track these and other excellent models in near real-time, or take our platform for a test drive with a free limited membership. Have questions? Learn more about what we do, check out our FAQs or contact us.
Edit: Our quote provider corrected for a handful of missing dividends in December. The result is that some of the returns above are slightly better than those that we originally published on 01/03/2017.

