One of the primary benefits of Tactical Asset Allocation (TAA) is the ability to manage losses during major market declines. TAA does that by reducing allocation to risk asset classes like stocks and real estate, and increasing allocation to defensive assets like bonds and gold.
In this post, we test how the 60+ TAA strategies we track would have fared through the 10 most significant market declines since 1970. These strategies are sourced from books, academic papers, etc., making these results broadly representative of TAA as a whole.
Rightly or wrongly, when most investors think of bear markets they think in terms of stocks, particularly US stocks, so we’ve used the S&P 500 as our guide (later we’ll show stats for the 60/40).
Here’s the key takeaway:
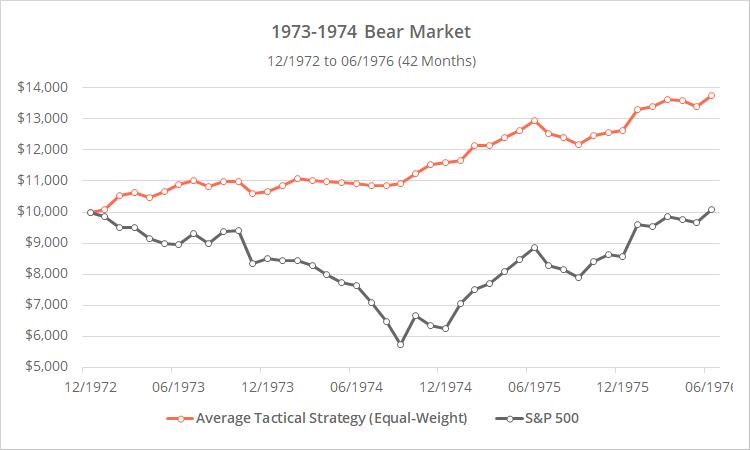
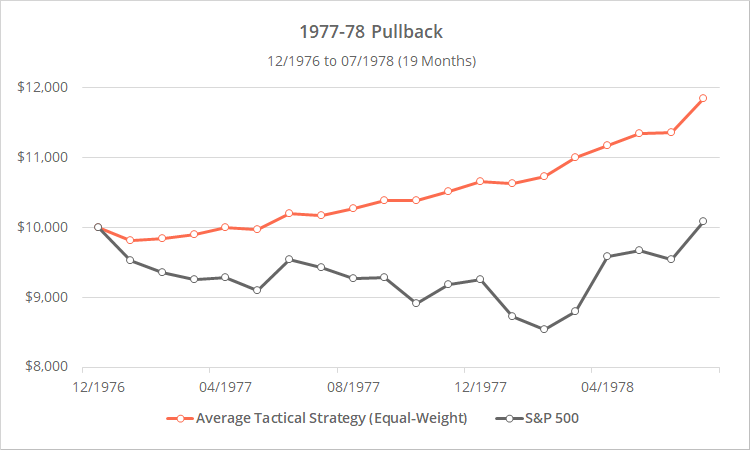
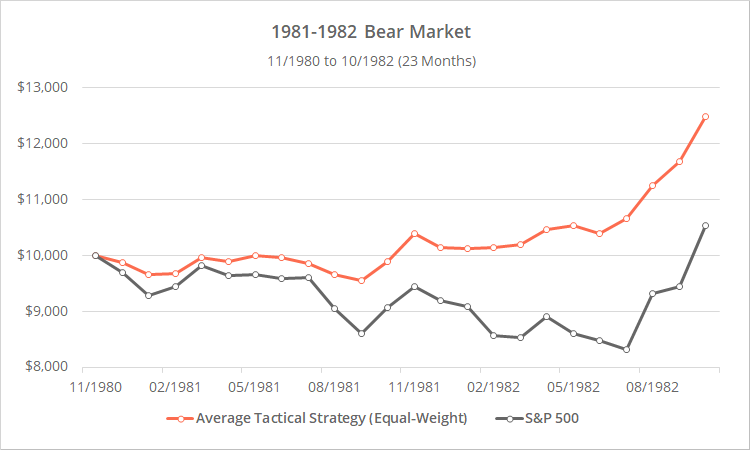
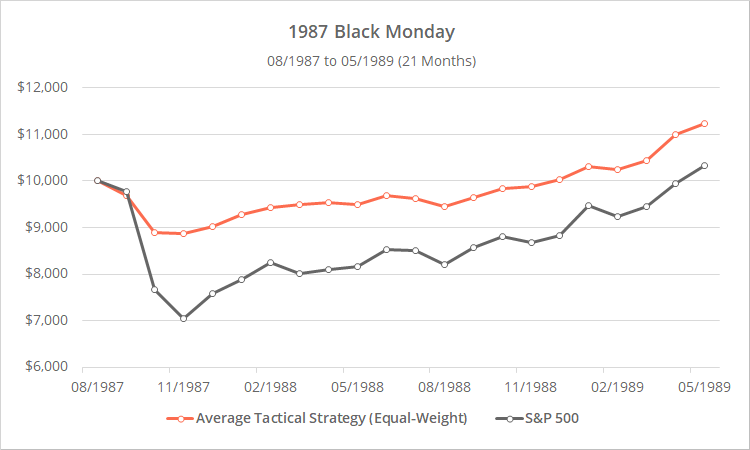
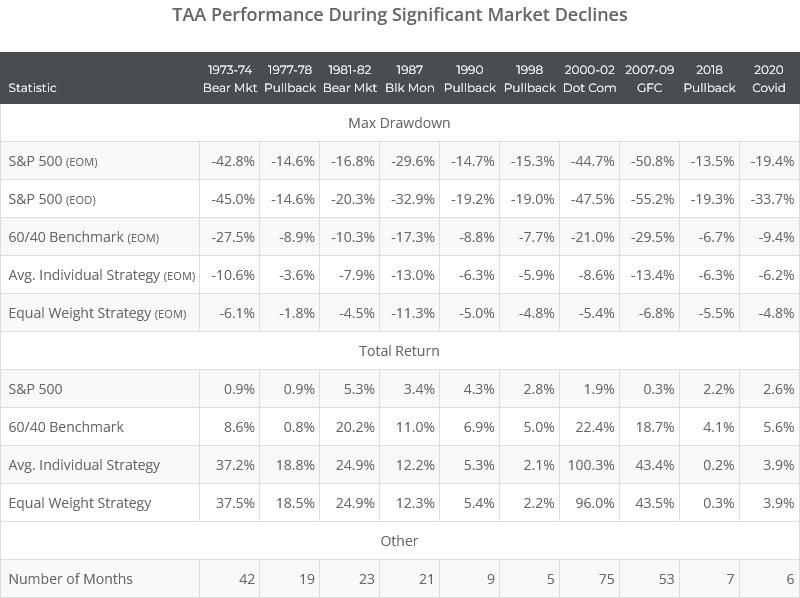
Across all market declines, TAA would have significantly reduced the maximum market drawdown, but the length of the decline and recovery determined TAA’s success over the full cycle:
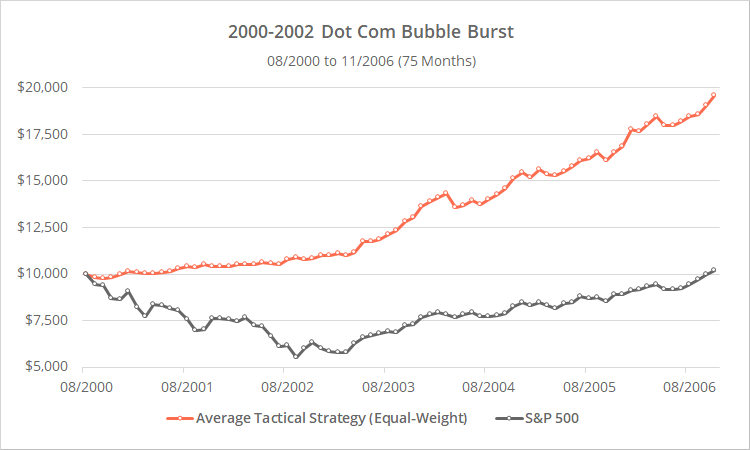
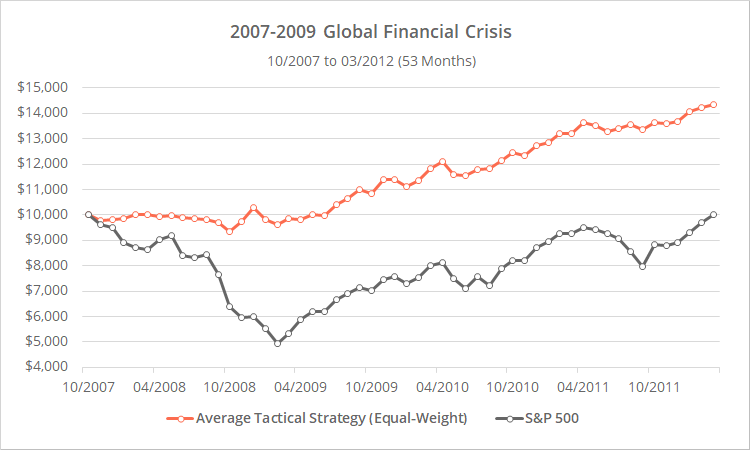
- During prolonged bear markets (like the 2007-09 Global Financial Crisis) TAA would have significantly outperformed the market as it sidestepped the worst of the decline and had time to begin slowly ramping up risk again as the market recovered. This is TAA’s bread and butter.
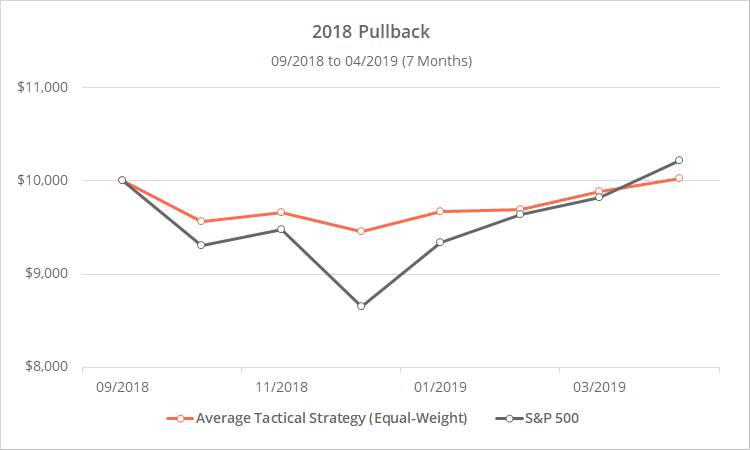
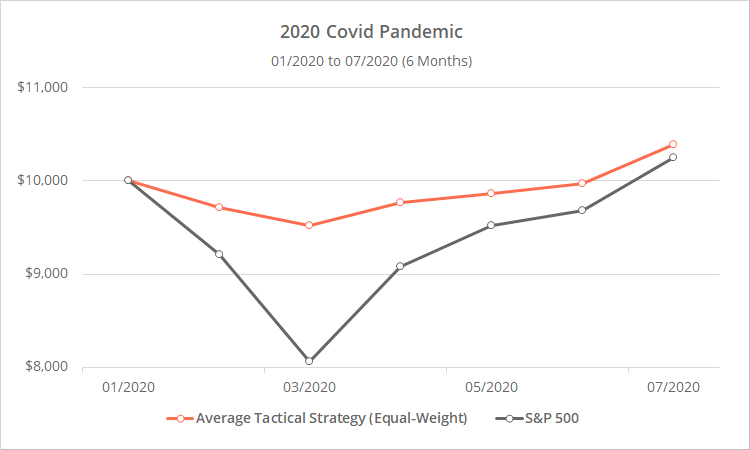
- During short, sharp pullbacks (like 2018 and 2020) TAA also would have sidestepped the worst of the market loss, but then given back that outperformance, because it was positioned too defensively for the sharp recovery.
Of course, when a market decline begins we don’t know which type it will eventually become. The same cautiousness that saves the portfolio in the prolonged bear market, causes the portfolio to be positioned too defensively for the short, sharp pullback. Net-net however, tactical has outperformed over the long-term, and we have to accept a little bitter to get the sweet.
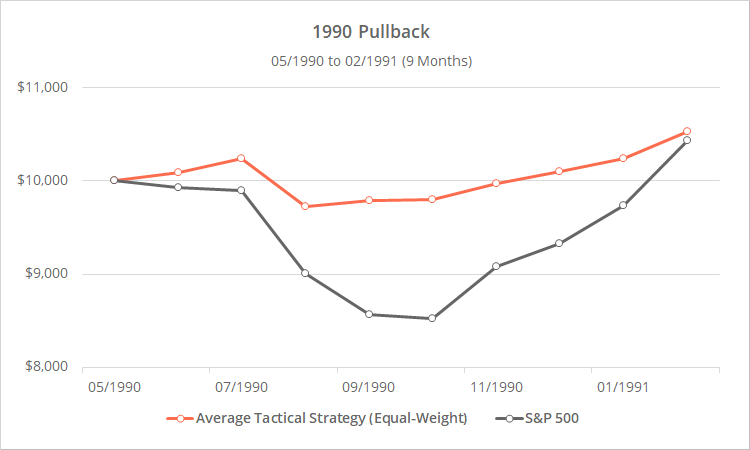
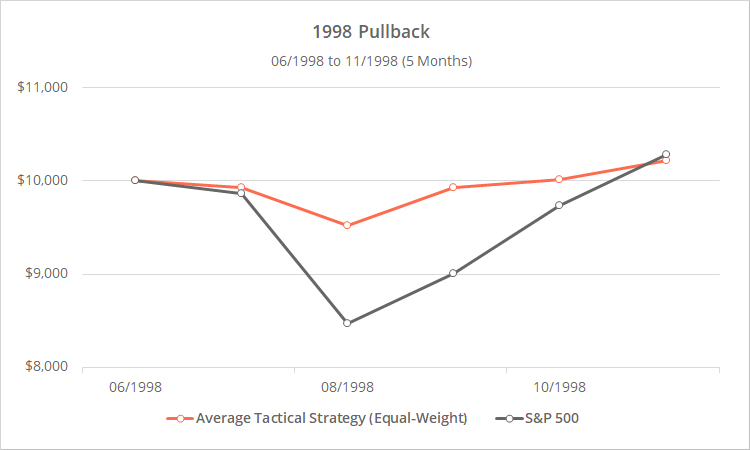
Data dump follows. Further discussion after the graphs. All results based on month end data.
Note: Technically, the 1990 pullback began at the end of May (based on month-end data). Practically speaking however, it really began two months later in July. If we instead used July as the start date, TAA would have underperformed over the full cycle.
Again, note the difference in TAA’s performance across prolonged bear markets vs short pullbacks. In both cases, TAA has sidestepped the worst of the market drawdown, but in short pullbacks, TAA has given up that outperformance during the recovery.
Summary stats follow.
Calculation notes and further discussion:
Average Individual vs Equal Weight Strategy Results (see table): The Average Individual results show the average max drawdown and total return for each of 60+ strategies we track over the period in question. This stat is more relevant if trading just a single strategy.
The Equal Weight results assume that we traded all strategies, equally weighted in a single portfolio (i.e. the platform-wide Aggregate Allocation). This equal weight data is more relevant to members who combine multiple strategies together into Model Portfolios. Max drawdown is reduced due to the usual benefits of diversification (i.e. this zigs when that zags, thus smoothing out returns).
3-Months to De-Risk: In previous analysis we’ve shown that it takes about 3-months for TAA (on average) to de-risk during bear markets, so some loss during the initial market decline is expected.
The right amount of delay is important. If strategies are too slow to respond, too much loss accumulates before they de-risk. If strategies are too quick to respond, they’re prone to whipsaw (i.e. repeatedly being on the wrong side of a vacillating market).
Why drawdown management is important: There’s a (wrong) point of view that drawdowns and volatility are irrelevant and only the terminal portfolio value matters. That’s easy to say when you view history from 30,000 feet up with the benefit of hindsight. It’s entirely different when you live a major market decline in real-time.
Experienced investors know that significant portfolio losses cause investors to make bad decisions, usually at the worst possible moment by selling low (not to mention inducing stomach ulcers). By managing declines and controlling volatility, we ensure that investors stay in the game, making rational calm decisions during periods of market turmoil.
Even in a world devoid of human emotion, there are quantitative advantages of managing drawdowns, like increasing retirement withdrawal rates.
EOM vs EOD results: Due to data limitations, we are unable to calculate end-of-day (EOD) results for many strategies in the earlier market declines. Learn more about monthly vs daily backtests. In order to compare apples to apples, we’ve used end-of-month (EOM) results across the board.
Also, each market decline only includes those strategies with data available over the full cycle. That’s 66 strategies for the 1998 pullback and beyond, 44 strategies for the 1973-74 bear market, and somewhere in between for the intervening drawdowns.
Benchmarking to the 60/40: We compared TAA’s performance to the S&P 500 in this post because most investors think about bear markets in terms of the stock market, but generally speaking we benchmark to the 60/40 on this site (60% US stocks, 40% US Treasuries).
All of the observations in this post hold with the 60/40 as well, just to a less exaggerated extent. TAA has also outperformed the 60/40 during major market declines in terms of max drawdown, but performance over the full cycle was determined by the length of the decline/recovery.
Bear market in progress in 1970 ignored: There was a bear market in progress when our earliest site backtests begin in 1970, so we don’t have strategy results over that full cycle. We’ve ignored that market decline here, but all indications are that it would have followed the same pattern.
In Summary:
To reiterate, across all market declines, TAA would have significantly reduced the maximum market drawdown, but the length of the decline and recovery determined TAA’s success over the full cycle:
- During prolonged bear markets (like the 2007-09 Global Financial Crisis) TAA would have significantly outperformed the market as it sidestepped the worst of the decline and had time to begin slowly ramping up risk again as the market recovered. This is TAA’s bread and butter.
- During short, sharp pullbacks (like 2018 and 2020) TAA also would have sidestepped the worst of the market loss, but then given back that outperformance, because it was positioned too defensively for the sharp recovery.
Of course, when a market decline begins we don’t know which type it will eventually become. The same cautiousness that saves the portfolio in the prolonged bear market, causes the portfolio to be positioned too defensively for the short, sharp pullback. Net-net however, tactical has outperformed over the long-term, and we have to accept a little bitter to get the sweet.
New here?
We invite you to become a member for about a $1 a day, or take our platform for a test drive with a free membership. Put the industry’s best tactical asset allocation strategies to the test, combine them into your own custom portfolio, and follow them in real-time. Learn more about what we do.
