Tactical Asset Allocation (TAA) dodged the worst of the bear in February and March, but trailed the big bounce in April. Entering May, TAA remains stubbornly defensive.
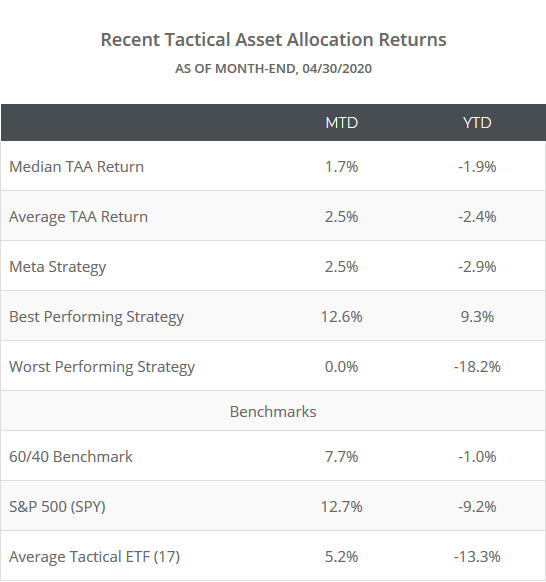
We track 50+ TAA strategies sourced from books, papers, etc., allowing us to draw broad conclusions about TAA as a style. In the table below we show the MTD and YTD returns of these 50+ strategies:
TAA is designed to earn its keep in times like we find ourselves in now, by knowing when to reduce risk exposure to protect the portfolio. So far it’s succeeded at that primary mission, with most strategies suffering minimal losses through this crisis. We’re still in the early days though, and we’ll only be able to judge TAA’s success or failure over a full cycle. We highly recommend reading the rest of this note to understand what to expect from TAA in the coming month.
TAA remains stubbornly defensive:
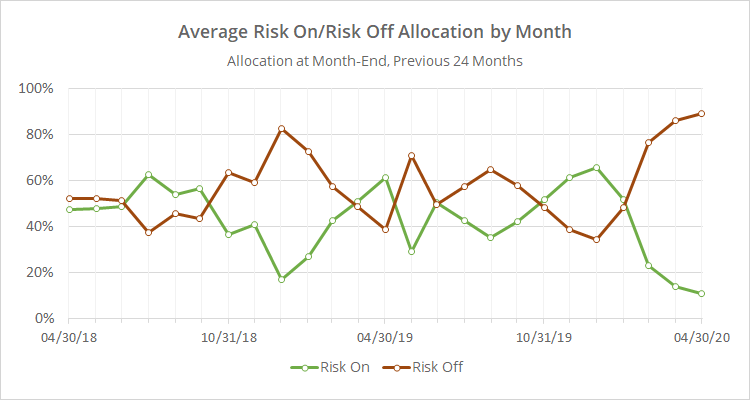
Despite the recent run up in risk assets, TAA is now 89% allocated to defensive assets like Treasuries and gold. That’s up from 86% defensive last month (see data dump below).
We would be lying if we said we weren’t a little bit surprised at how stubborn TAA remained in the face of the big April run up. A lot of strategies were on the cusp of shifting into risk assets at month-end, but few ended up making the switch.
We view portfolio allocation as being on a spectrum, alternating between either moderately risky or moderately defensive, but rarely reaching extremes. There are usually too many unknowns at any given time to take an overly bold position either way. This is one of those rare times where TAA finds itself at an extreme. That’s great if this market heads south again, but it exposes TAA to significant risk if the market continues to recover from here.
Data dump:
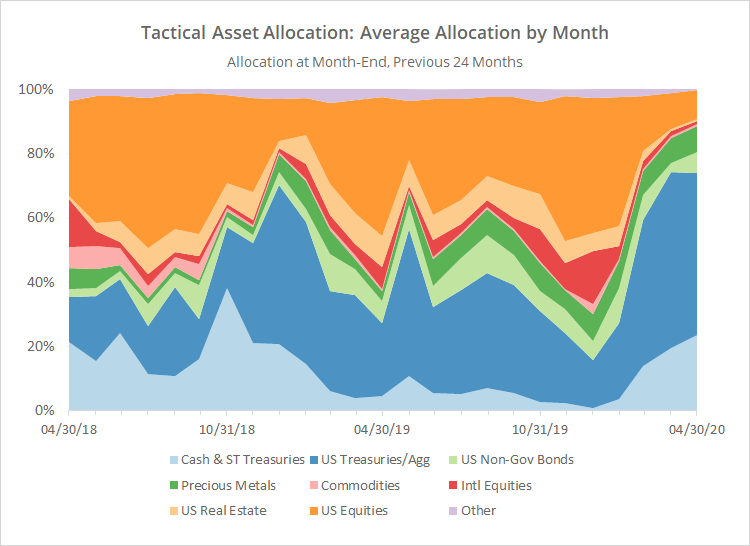
The following two charts help to show trends in the asset classes that TAA is allocating to over time, based on the 50+ public models that we track.
The first chart shows the average month-end allocation to categories of assets. For example, “US Equities” may include everything from the S&P 500 to individual stock market sectors. Defensive assets tend to be at the bottom of the chart, and offensive at the top. The data on the far right of the chart shows where TAA stood as of the end of April.
There were no significant shifts in any categories of assets. A bit less US Treasuries and equities, a bit more non-gov bonds and cash.
In the second chart below, we’ve combined average TAA allocation into even broader categories: “risk on” (equities, real estate and high yield bonds) versus “risk off” (everything else). We realize that some asset classes don’t fit neatly into these buckets, but it makes for a useful high-level view.
The current 89% allocation to defensive assets is the highest reading since the 2008 GFC when it peaked at 92%.
New here?
We invite you to become a member for about a $1 a day, or take our platform for a test drive with a free limited membership. Put the industry’s best tactical asset allocation strategies to the test, combine them into your own custom portfolio, and follow them in near real-time. Not a DIY investor? There’s also a managed solution. Learn more about what we do.


