This is a summary of the recent performance of a wide range of excellent tactical asset allocation strategies. These strategies are sourced from books, academic papers, and other publications. While we don’t (yet) include every published TAA model, these strategies are broadly representative of the TAA space. Learn more about what we do or let AllocateSmartly help you follow these strategies in near real-time.
| Recent Performance of Asset Allocation Strategies Use the Arrows to Sort This Table |
||||
|---|---|---|---|---|
| MTD/YTD Return | Adjusted for Timing Luck (*) | |||
| Strategy | Mar | YTD | Mar | YTD |
| Adaptive Asset Allocation | 1.55% | 2.84% | 1.38% | 2.00% |
| Varadi’s Minimum Correlation Portfolio | 1.34% | -0.86% | 1.41% | -1.08% |
| Faber’s Ivy Portfolio | 0.66% | -1.95% | 0.66% | -1.95% |
| Dalio’s All-Weather Portfolio | 0.64% | -1.70% | 0.64% | -1.70% |
| US Equal Risk Contribution | 0.45% | -2.34% | 0.46% | -2.45% |
| PortfolioCharts’ Golden Butterfly | 0.37% | -1.13% | 0.37% | -1.13% |
| Faber’s Trinity Portfolio Lite | 0.30% | 0.27% | 0.27% | -0.01% |
| Varadi’s Percentile Channels | 0.26% | -0.93% | 0.17% | -1.72% |
| Faber’s Global Tactical Asset Alloc. – Agg. 6 | 0.25% | 1.19% | -0.38% | 0.36% |
| Global Risk Parity Trend Following | 0.25% | -0.51% | 0.25% | 0.20% |
| Browne’s Permanent Portfolio | 0.17% | -0.60% | 0.17% | -0.60% |
| Vigilant Asset Allocation | 0.14% | 8.47% | 0.14% | 1.80% |
| Protective Asset Allocation | 0.12% | 2.44% | -0.05% | 1.59% |
| US Min Correlation | 0.12% | -1.98% | 0.16% | -2.17% |
| Novell’s Tactical Bond Strategy | 0.11% | -2.80% | 0.20% | -2.90% |
| Faber’s Global Tactical Asset Alloc. 13 | -0.03% | -0.34% | -0.04% | -0.69% |
| US Risk Parity Trend Following | -0.03% | 0.45% | -0.06% | -0.15% |
| US Max Diversification | -0.09% | -1.36% | -0.08% | -1.44% |
| Composite Dual Momentum | -0.15% | -3.28% | 0.86% | -2.70% |
| Faber’s Global Tactical Asset Alloc. 5 | -0.20% | -0.60% | -0.23% | -0.83% |
| Robust Asset Allocation – Balanced | -0.22% | -0.89% | -0.22% | -1.05% |
| Efficiente Index | -0.25% | 0.10% | -0.23% | -0.21% |
| Allocate Smartly’s Meta Strategy | -0.27% | 0.83% | -0.27% | 0.83% |
| Stoken’s Active Combined Asset – Monthly | -0.32% | -1.09% | -0.31% | -2.07% |
| Tactical Permanent Portfolio | -0.32% | 1.28% | -0.40% | -0.40% |
| Stoken’s Active Combined Asset | -0.35% | -5.38% | -0.35% | -5.38% |
| Protective Asset Allocation – CPR | -0.37% | 2.18% | -0.58% | 1.39% |
| Keuning’s Generalized Protective Momentum | -0.56% | 0.18% | -0.28% | 1.07% |
| Flexible Asset Allocation | -0.75% | 1.42% | -0.81% | -0.05% |
| Traditional Dual Momentum | -0.84% | -0.90% | -2.42% | -2.48% |
| Davis’ Three Way Model | -1.06% | -2.21% | -1.08% | -2.39% |
| 60/40 Benchmark | -1.18% | -1.29% | -1.18% | -1.29% |
| Faber’s Global Tactical Asset Alloc. – Agg. 3 | -1.32% | 1.47% | -1.84% | 0.77% |
| Robust Asset Allocation – Aggressive | -1.33% | -0.66% | -1.34% | -0.70% |
| Classical Asset Allocation – Defensive | -1.63% | 0.71% | -1.47% | 1.27% |
| Classical Asset Allocation – Offensive | -1.78% | 1.40% | -1.78% | 1.34% |
| Elastic Asset Allocation – Offensive | -2.01% | 0.17% | -1.93% | 0.04% |
| US Max Sharpe | -2.09% | -3.07% | -1.84% | -2.72% |
| Elastic Asset Allocation – Defensive | -2.13% | 0.07% | -1.65% | 0.12% |
| Philosophical Economics’ Growth-Trend Timing | -2.74% | -1.00% | -2.74% | -1.00% |
| Glenn’s Paired Switching Strategy | -2.74% | -1.00% | -2.74% | -1.00% |
| Faber’s Sector Relative Strength | -3.43% | -0.15% | -3.42% | -0.21% |
Commentary:
 TAA successfully pared down market losses in March, with 3 out of 4 strategies outperforming the 60/40 benchmark. Strategies that began the month underweight US equities generally fared well as they included some of the worst performing asset classes for the month (ex. SPY -2.74% and MTUM -3.45%).
As we’ve been writing about for the last couple of months, TAA continues to slowly de-risk. There are still a number of strategies that stubbornly remain in full risk on mode (most of which did poorly in March), but as we’ll show in a moment, generally-speaking TAA continues to decrease risk exposure. For the first time since mid-2016, allocation to defensive assets now outweighs allocation to offensive assets.
Data Dump:
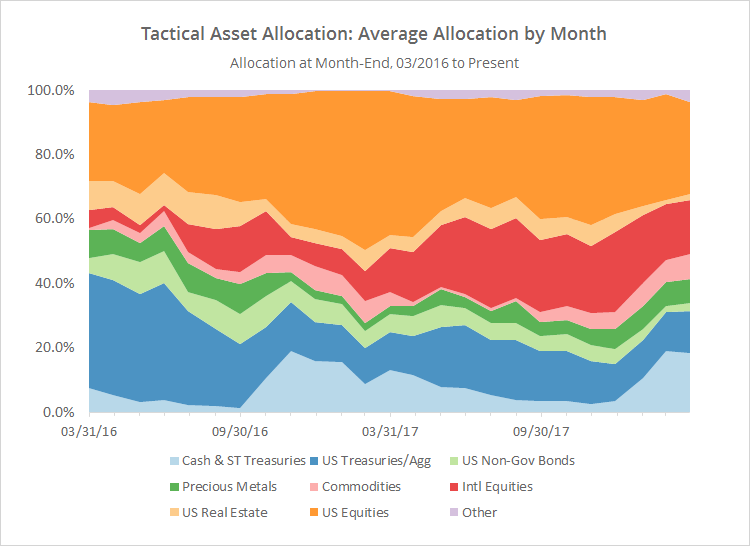
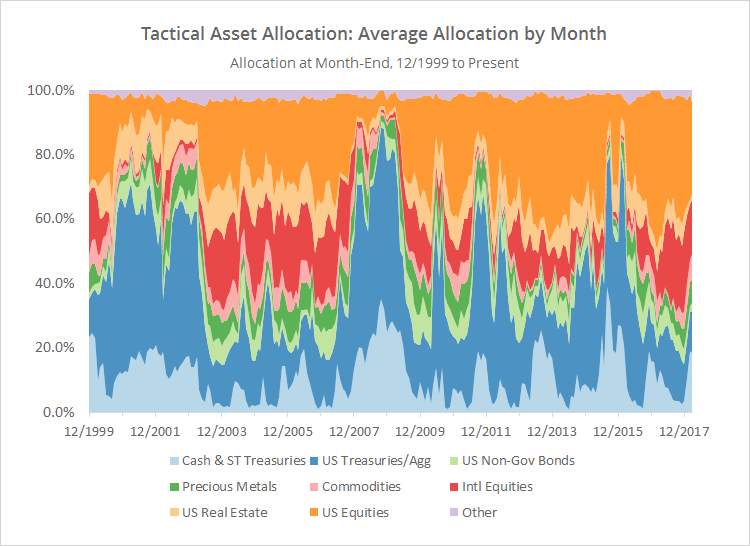
With such a large pool of published strategies to draw on (42 and counting), we’re able to draw some broad conclusions about the state of TAA. The following two charts help to show trends in the asset classes that TAA as a whole is allocating to over time.
The first chart shows the average month-end allocation to categories of assets by all of the strategies that we track. For example, “US Equities” may include everything from the S&P 500 to individual stock market sectors. Defensive assets tend to be at the bottom of the chart, and offensive at the top. The data on the far right of the chart reflects where TAA stood as of the end of the month.
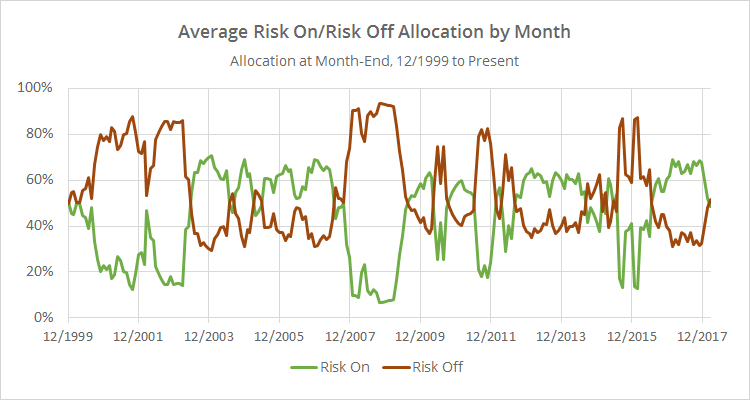
In the second chart below, we’ve combined average TAA allocation into even broader categories: “risk on” (equities, real estate and high yield bonds) versus “risk off” (everything else). We realize that some asset classes don’t fit neatly into these buckets, but it makes for a useful high level view.
This chart shows that for the first time since mid-2016, allocation to defensive assets outweighs allocation to offensive assets (click for a longer view). It’s important to note, that isn’t the same thing as risk exposure. Risk assets by their nature tend to be more volatile, so in terms of exposure, TAA is probably still in a “risk on” state. That’s a good thing if this bull market picks back up, but it means that there remains exposure to investors here if the market continues to fall in April.

We invite you to become a member for about a $1 a day, or take our platform for a test drive with a free limited membership. Put the industry’s best tactical asset allocation strategies to the test, combine them into your own custom portfolio, and then track them in near real-time. Have questions? Learn more about what we do, check out our FAQs or contact us.