This is the first of a multipart series examining the selection of Tactical Asset Allocation (TAA) strategies based on recent performance.
We are proponents of combining multiple TAA strategies together into what we call Model Portfolios to limit the risk of any single strategy going of the rails. In this study we ask, what if, each month, we selected strategies for our portfolio that had performed best in recent history.
We track 100+ TAA strategies, making these findings broadly representative of TAA as a trading style.
Results from 1973:
We assume that at the end of each month the investor looked at the return of all 100+ strategies we track over the last X months. The investor then selected the top Y strategies and traded those Y strategies for the following month (equally-weighted).
We show results across four metrics, starting with annualized return. For comparison, we also include a portfolio of all strategies we track (the “average strategy”), as well as the 60/40 benchmark.
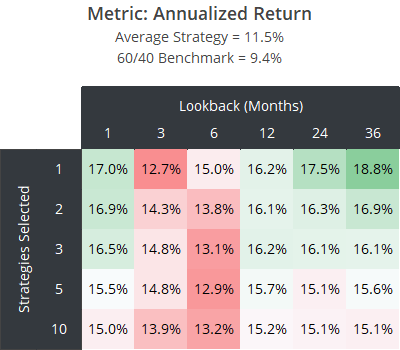
All combinations of lookbacks and portfolio sizes significantly outperformed the average strategy in terms of pure return. That should be unsurprising. We track a wide range of strategies from conservative to aggressive, but selecting the top recent performers (as well as bottom recent performers) will tend to select the riskiest strategies.
What we really want to understand is risk-adjusted return. Next, we look at the Sharpe Ratio.
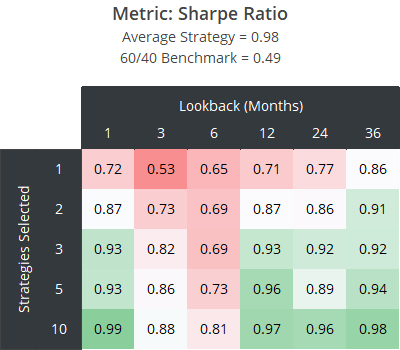
As the number of strategies selected increases, the Sharpe Ratio approaches the average strategy, but no combination significantly outperforms the average strategy.
Put another way, at some point, as the number of strategies selected increases, we reach a sufficiently diversified portfolio to match average strategy results, but selecting strategies based on recent performance doesn’t appear to add additional value.
Next, we look at two measures of loss: Max Drawdown and the Ulcer Performance Index (UPI). We believe Max Drawdown is of limited value; it’s capturing a single point in time. UPI is our preferred measure of drawdown-adjusted return as it considers return relative to both the depth and length of all drawdowns.
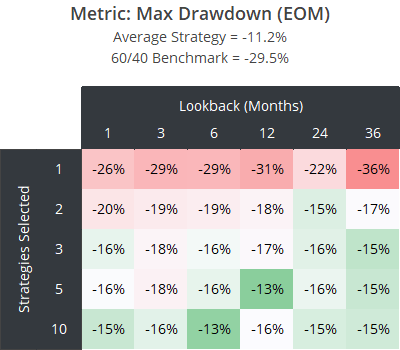
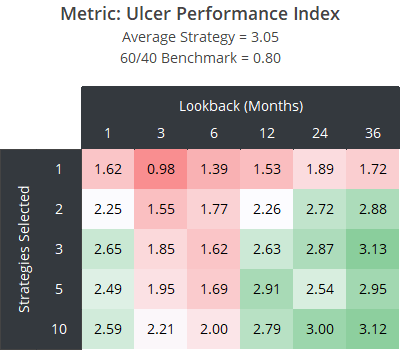
These results tell a similar story. In terms of minimizing drawdown, selecting the 1 to 2 top recent performers has been terrible. No combination has significantly outperformed the average strategy.
It’s interesting that across 3 out of 4 metrics, results deteriorate badly with a 3 to 6 month lookback. It appears that selecting strategies that have outperformed over the last 3 to 6 months (solely because they’ve outperformed) has been an especially bad idea.
A fly in the ointment:
At longer lookbacks and larger portfolio sizes (i.e. the bottom right of each table), these results are essentially in line with the average TAA strategy on a risk-adjusted basis (Sharpe and UPI). There has been no significant advantage, but also no significant disadvantage to selecting strategies based on recent performance.
However, there’s an important consideration we didn’t account for: trading friction (transaction costs + slippage). As always, we accounted for trading friction in our individual strategy backtests, but for simplicity, we didn’t account for the additional friction of switching between strategies.
This means that actual results would have been worse than what we’ve presented here. That really puts a nail in the coffin of the idea of chasing recent performance when selecting strategies.
Our advice for selecting strategies remains the same:
Select a broad range of diverse, robust, high-quality strategies. Consider avoiding strategies that have significantly underperformed their own historical norms (see the Underperformer Watchlist) until performance is better understood, but beyond those extreme cases, recent performance shouldn’t be a factor in strategy selection.
Outro:
As mentioned, this is the first of a multipart series. Be on the lookout for additional tests in the coming weeks, like selecting strategies with the highest recent volatility-adjusted return, and conversely, selecting underperforming strategies.
New here?
We invite you to become a member for about a $1 a day, or take our platform for a test drive with a free membership. Put the industry’s best tactical asset allocation strategies to the test, combine them into your own custom portfolio, and follow them in real-time. Learn more about what we do.
