This is the third installment in a series on selecting Tactical Asset Allocation (TAA) strategies based on recent performance. Read Part 1 and Part 2.
We advocate combining multiple TAA strategies together into “Model Portfolios” to limit the risk of any single strategy underperforming. In our previous studies we selected strategies for our Model Portfolio based on recent return. In this study, each strategy in our portfolio is switched on and off based on trend-following – often called “surfing the equity curve”.
We track 100+ TAA strategies, making these findings broadly representative of TAA as a trading style.
Results from 1973:
We use a classic trend-following approach: comparing a shorter moving average (MA) to a longer one. We assume that the investor split the portfolio evenly across all 100+ strategies.
Each strategy is switched on or off independently. At the end of each month, if the strategy’s shorter X month MA was greater than its longer Y month MA, the investor allocated to that strategy; otherwise, that portion of the portfolio remained in cash.
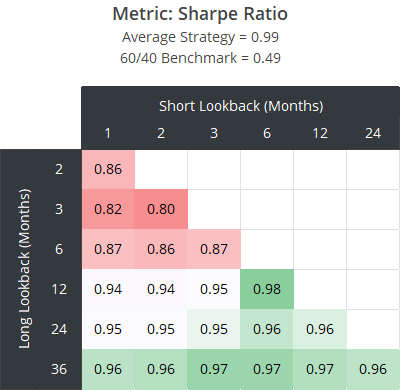
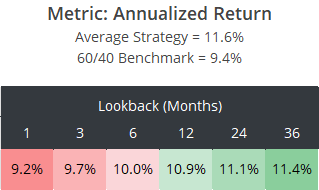
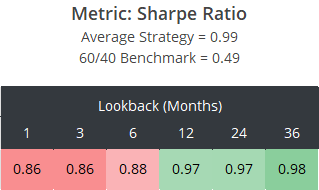
We’ll show results for our hypothetical portfolios across four metrics, starting with annual return and Sharpe Ratio. For comparison, we also include the average strategy we track and 60/40 benchmark.
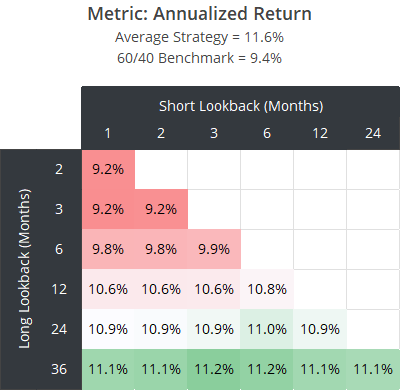
The longer the long MA, the more months the investor spent invested in each strategy. The average proportion of the portfolio invested ranged from little as 69% (1/2-month crossovers), up to 96% (2/36-month crossovers).
Unsurprisingly, because shorter MAs spent so little time invested, annual return suffered. Over the long-term, cash (T-Bills) will underperform nearly all assets. The Sharpe Ratio adjusts for that by looking at (excess) return per unit of risk, but here too we see shorter MAs underperform. Longer MAs were more effective, but all combinations still failed to outperform the average strategy.
A primary benefit of trend-following has been managing losses, so perhaps this is where we’ll see “surfing the equity curve” shine.
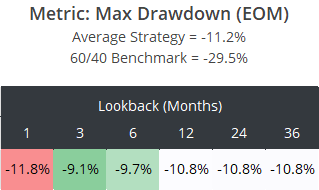
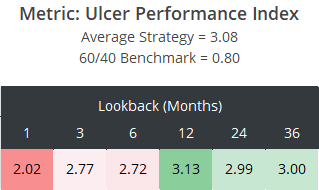
Below we look at two measures of loss: Max Drawdown and the Ulcer Performance Index (UPI). We believe Max Drawdown is of limited value; it’s capturing a single moment in time. UPI is our preferred measure because it considers return relative to both the depth and length of all drawdowns.
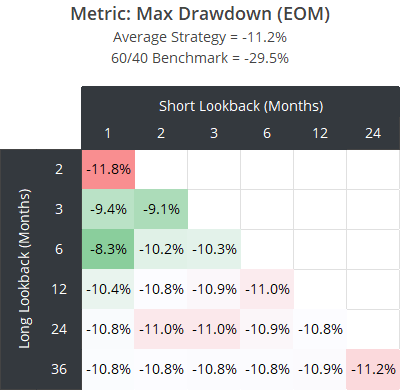
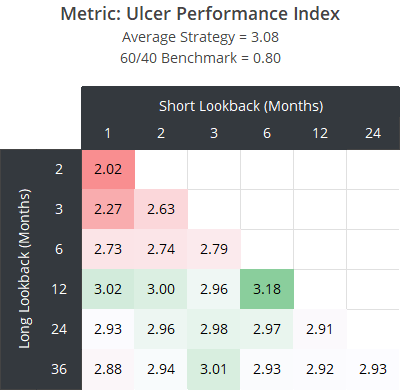
Nearly all combinations improved the portfolio’s max drawdown. That isn’t too surprising; cash (T-Bills) is a zero drawdown asset. What’s more relevant is that relative to return (i.e. UPI), all combinations still underperformed the average strategy except one (6/12-month crossovers).
Looking at the heatmap as a whole, we view the outperformance of that single 6/12-month combination as likely luck/noise.
What about “absolute momentum”?
Closely related to trend-following is “absolute momentum”. Here we run the same test, this time investing in each strategy if the strategy’s return over the last X months was > 0.
These results are all in line with our previous trend-following tests. No new information here.
Geek note: We also tested another common absolute momentum approach. Rather than comparing the strategy’s return over the last X months to zero, we compared it to the return on T-Bills. Such an approach would have spent even less time in the market, and further reduced annual return and improved max drawdown, but led to no improvement in risk-adjusted performance (Sharpe/UPI).
Reminder: These results do not account for all trading frictions:
A reminder from our previous analyses: these results account for trading frictions (transaction costs + slippage) in the individual strategy backtests, but do not account for the additional friction of switching the strategies on/off. That means that actual results would have been worse than what we’ve presented here.
Debunking the idea of “surfing the equity curve”:
We’ve seen many analyses showing that applying some trend-following approach as an “overlay” to such-and-such strategy would have improved performance. We generally view those analyses as overfitting, and the results in this article demonstrate why.
If a trend-following overlay can’t be applied broadly to all strategies across a consistent set of parameters (as we’ve done here), and instead relies on one set of trend-following parameters specifically tuned to one particular strategy, then the benefit of that one set of parameters applied to that one specific strategy is almost certainly a result of overfitting.
While it’s true that we haven’t tested every possible approach to trend-following, if none of these simple tried-and-true approaches show promise, it’s hard to put faith in a more complex (and likely overfit) one.
Outro:
Our advice for selecting strategies remains the same:
Select a broad range of diverse, robust, high-quality strategies. Consider avoiding strategies that have significantly underperformed their own historically-derived expectations until performance is better understood (see the Underperformer Watchlist), but beyond those extreme cases, do not consider recent performance in strategy selection.
As mentioned, this is the third article in a series. Be on the lookout for additional tests in the coming weeks in search of an effective approach for selecting strategies based on recent performance.
New here?
We invite you to become a member for about a $1 a day, or take our platform for a test drive with a free membership. Put the industry’s best tactical asset allocation strategies to the test, combine them into your own custom portfolio, and follow them in real-time. Learn more about what we do.
