We’ve added Safe and Perpetual Withdrawal Rates to your custom Model Portfolios.
New here? Learn more: What is a Model Portfolio?
What are Withdrawal Rates?
The Safe Withdrawal Rate (SWR) measures the max amount that could have been withdrawn each year in retirement (with an annual adjustment for inflation) without running out of money over the worst retirement period. It’s the source of the well-known “4% withdrawal” rule in financial planning.
The Perpetual Withdrawal Rate (PWR) is a more conservative measure. Rather than a goal of not running out of money, the goal is to preserve the entire initial inflation-adjusted portfolio.
To clarify: We’ve always provided withdrawal rates for individual strategies (see the report). We’ve now added that same capability to Model Portfolios as well.
Where to find Model Portfolio withdrawal rates:
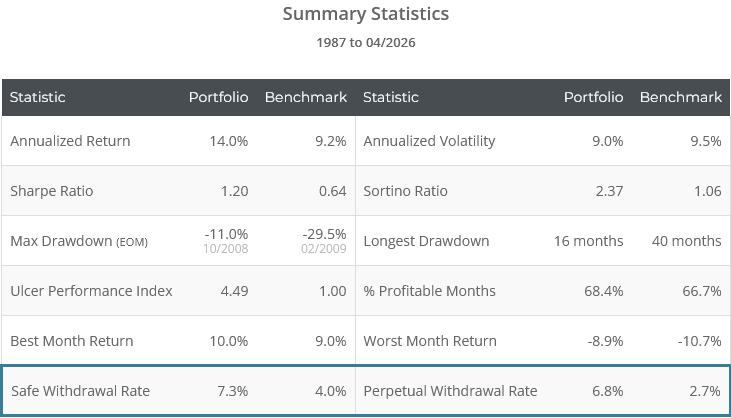
You can find the SWR and PWR values at the bottom of the summary stats table.
For example, here are the results for a Model Portfolio split 50/50 between the two most popular strategies on our platform: Financial Mentor’s Optimum3 and Dr. Keller’s Hybrid Asset Allocation. Note the new stats shown at the bottom.
In the case of individual strategies, members can tweak the withdrawal rate analysis by changing retirement length and inflation assumptions, but in order to speed up Model Portfolio backtests, we only provide results based on a 30-year retirement/historical inflation.
We think that meets 99% of members’ needs. Results based on other assumptions tend to scale up or down in line with that baseline result. We may add a more intense withdrawal rate analysis in the future (like we do for individual strategies) depending on member demand.
Calculation note: Withdrawal Rates and the Compare Tool:
We also now provide SWR/PWR results on the Compare Tool for all strategies, Model Portfolios and benchmarks. An important calculation note:
The Compare Tool aligns strategies to their earliest common start date and shows stats based on that common start date. SWR/PWR is the one exception; we’ll always show the full sample SWR/PWR.
Why? Withdrawal rates are a unique statistic. They are based on the single worst n-year period in the test. Strategy A could dominate Strategy B by every other measure, but still have a lower SWR/PWR because of a single bad/unlucky series of n-year returns.
That means that analyzing less data can only “improve” SWR/PWR, but that improvement is an illusion. We take the more conservative, pessimistic (and we’d argue, realistic) approach of always showing the full sample withdrawal rate.
A word of warning about withdrawal rates and short backtests:
The discussion above hints at something else members should bear in mind.
When you backtest your Model Portfolio, withdrawal rates are calculated based on your unique combination of strategies/assets. The shorter the backtest, the less conservative the withdrawal rate analysis will be. Withdrawal rates are based on the worst n-year period, and a shorter backtest means there are less n-year periods to consider.
Let’s say you test Model Portfolio A, which begins in 1970, and calculate an SWR of 5%. You then test Model Portfolio B, which begins in 1990, and calculate an SWR of 7%.
You should not naively assume that Portfolio B definitely has a higher withdrawal rate. It could simply be the lucky result of a much shorter backtest. We have to take into account backtest length when comparing any statistic, but it’s even more important when comparing withdrawal rates.
Methodology (for the geeks): How we calculate Withdrawal Rates
We use the approach described by William Bengen in his paper “Determining Withdrawal Rates Using Historical Data”.
We run separate simulations starting on every possible starting quarter in the backtest. When insufficient data exists to project forward n years, we “loop around” to the start of the sample, maintaining the sequence of returns. For a portfolio that begins in 1970, that would result in 200+ unique sequences. Withdrawal rates are based on the worst n year period in the test.
As always, use common sense:
Withdrawal rate analysis, like all investment analysis, involves a degree of uncertainty. The future is guaranteed to be different, and actual withdrawal rates could be significantly higher or lower than modeled results. It would be reckless to plan for retirement as if these values were chiseled in stone. When it comes to financial planning, investors should always err on the side of caution.
New here?
We invite you to become a member for about a $1 a day, or take our platform for a test drive with a free membership. Put the industry’s best Tactical Asset Allocation strategies to the test, combine them into your own custom portfolio, and follow them in real-time. Learn more about what we do.
