Every strategy and Model Portfolio now includes a Return Contribution analysis, showing each asset’s contribution to overall annual return. We further aggregate results by asset category and risk on/off, as well as estimate the drag from “trading friction” (transaction costs + slippage).
Let’s walk through a sample return contribution analysis using the most popular strategy on our platform: Financial Mentor’s Optimum3.
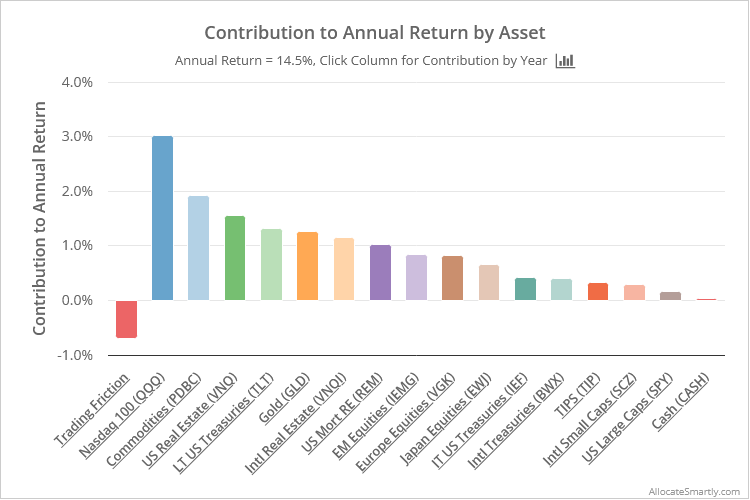
Return contribution by asset:
In the first chart we show each asset’s contribution to the overall strategy annual return of 14.5%. The chart shows that QQQ has been the biggest contributor at 3.1%, while trading friction has reduced return by about 0.7% per year.
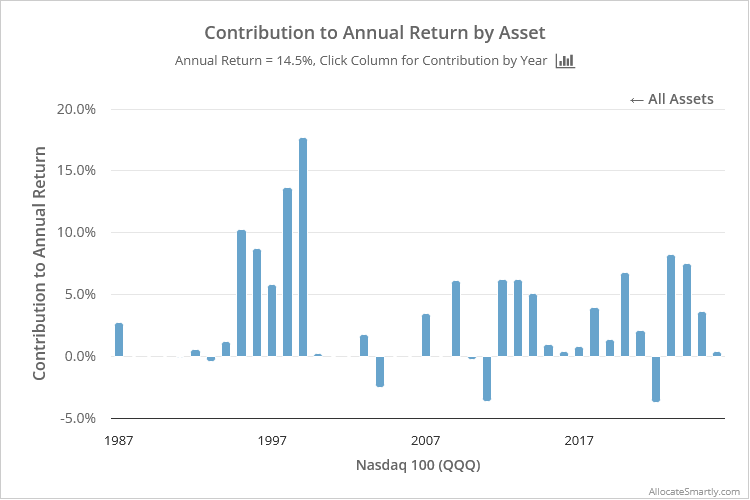
You can click on any column (not in this article, but in the members area) to see that asset’s contribution by year. Below is the contribution from QQQ by year. Unsurprisingly, QQQ was most effective in the mid to late 1990’s.
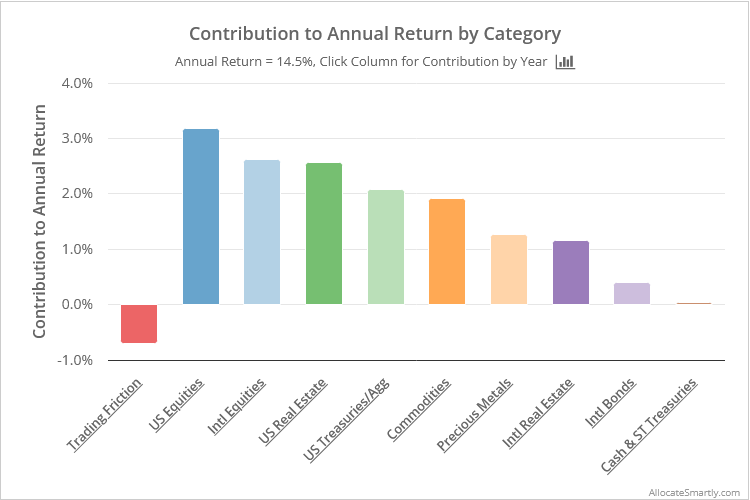
Return contribution by asset category:
We also roll up results into broad categories. For instance, “US Equities” may include everything from the S&P 500 to individual stock market sectors. This sometimes makes it easier to interpret the data if a strategy trades many assets.
An example: it wasn’t clear from the first graph that international equities have been such a major contributor to strategy performance.
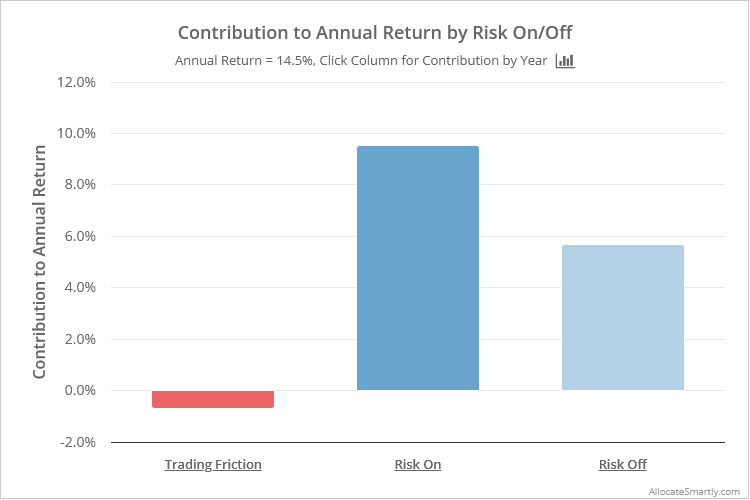
Return contribution by risk on/off:
Finally, we combine assets into the broadest possible categories: risk on and risk off. Risk on includes equities, real estate and high-yield bonds; risk off includes everything else. Not all assets fit neatly into these buckets, but this simplification provides a useful high-level view.
How you can use this data in your own analysis:
There isn’t a hard rule for what this data should look like. The usefulness of the data is going to depend on the strategy. Here’s a practical example.
Recall our recent analysis of Carlson’s Defense First. The strategy allocates, on average, about 10% of the portfolio to the US Dollar index (UUP), but UUP has contributed almost nothing to the strategy’s return. Factoring in real-world trading friction (transaction costs + slippage), we concluded that it might make sense to skip those positions and instead allocate to cash or short-term Treasuries.
That bears out in the Return Contribution analysis.
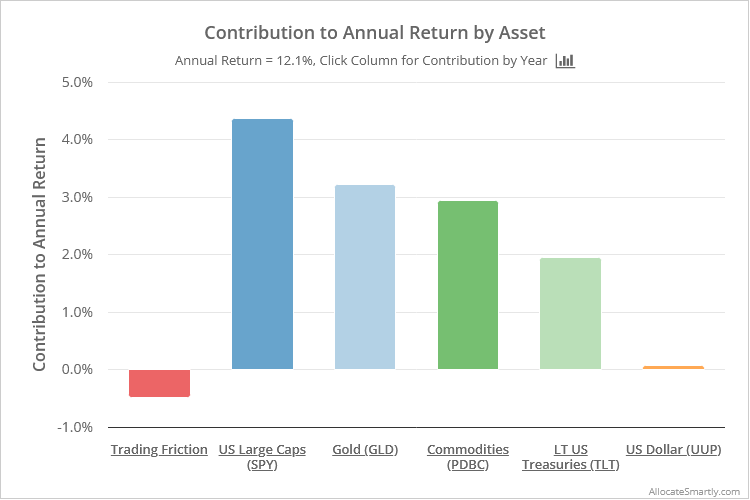
UUP contributed just 0.07% to annual return. Drilling down on the results by year we see that returns when holding UUP have been consistently inconsistent.
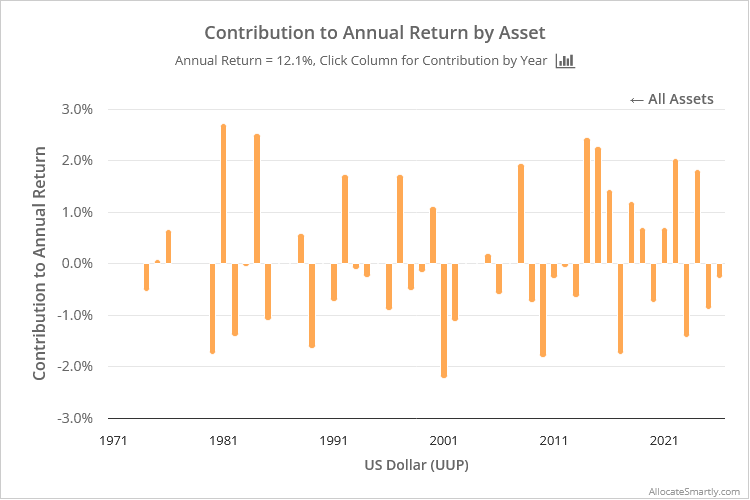
Again, the Return Contribution analysis confirms our conclusion that UUP has been an unproductive position, especially after accounting for trading friction (we understand it’s purpose is diversification, but a zero expectancy asset probably isn’t a good way to accomplish that).
This is just one simple example of the usefulness of the Return Contribution analysis. In the end, the purpose is really just understanding strategies better so that members can better judge the efficacy of the strategy and the assets traded.
New here?
We invite you to become a member for about a $1 a day, or take our platform for a test drive with a free membership. Put the industry’s best Tactical Asset Allocation strategies to the test, combine them into your own custom portfolio, and follow them in real-time. Learn more about what we do.
