This is the second installment in a multipart series on selecting Tactical Asset Allocation (TAA) strategies based on recent performance. Read Part 1.
We advocate combining multiple TAA strategies together into “Model Portfolios” to limit the risk of any single strategy underperforming. In our previous study we selected strategies for our portfolio with the highest recent return. In this study, we select strategies with the highest recent volatility-adjusted return, aka “Sharpe Ratio”.
We track 100+ TAA strategies, making these findings broadly representative of TAA as a trading style.
Results from 1973:
Sharpe Ratio = (return – risk-free rate) / volatility.
We assume that at the end of each month the investor looked at the Sharpe Ratio over the last X months of all 100+ strategies we track. The investor selected the top Y strategies and traded those Y strategies for the following month (equally-weighted).
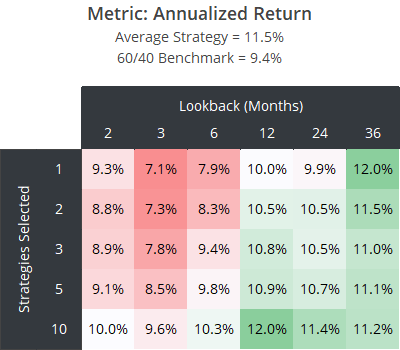
We’ll show results for our hypothetical portfolios across four metrics, starting with annualized return. For comparison, we also include the average strategy we track, as well as the 60/40 benchmark.
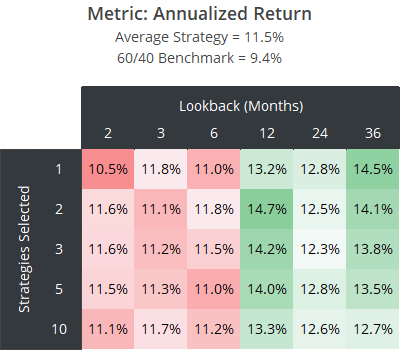
Recall from our previous study that selecting strategies with the highest return tended to select riskier strategies, and thus all combinations of lookbacks and portfolio sizes produced significantly higher returns than the average strategy.
That holds somewhat true here as well. Because the Sharpe Ratio includes a “risk-free hurdle” (T-Bills), it also rewards higher returning strategies, independent of risk. Later we’ll look at removing this risk-free hurdle.
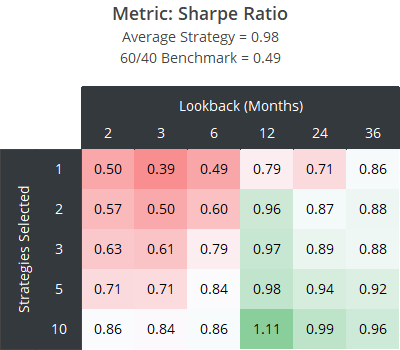
What we really want to understand is how this approach performs on a risk-adjusted basis. Next, we look at the Sharpe Ratio of our hypothetical portfolios.
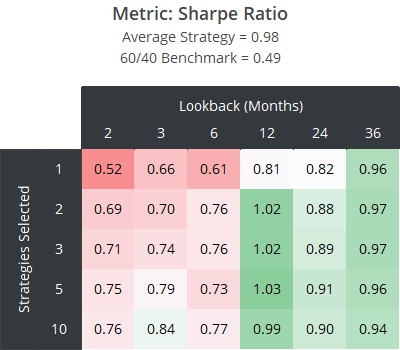
No combination of lookbacks and portfolio sizes significantly outperformed the average strategy; at least to a degree that makes this approach worthwhile.
There was a stark difference between 12+ month lookbacks and shorter lookbacks. This was true across all four metrics. Selecting strategies based on their Sharpe Ratio over less than 12 months has been particularly ineffective.
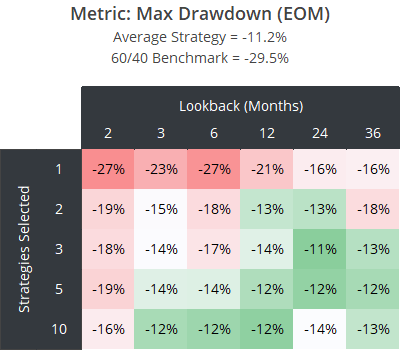
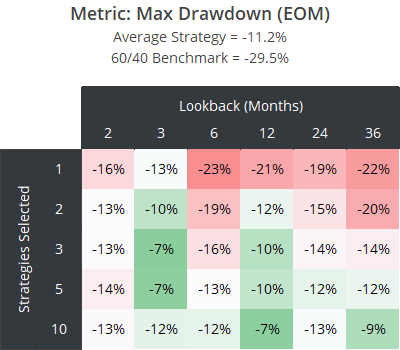
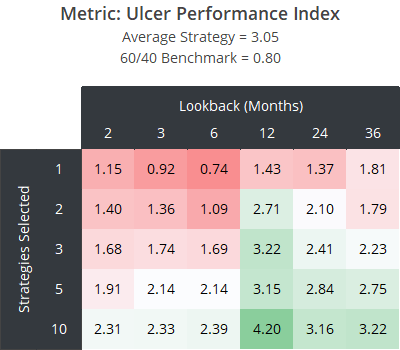
Next, we look at two measures of loss: Max Drawdown and the Ulcer Performance Index (UPI). We believe Max Drawdown is of limited value; it’s capturing a single moment in time. UPI is our preferred measure of drawdown-adjusted return because it considers return relative to both the depth and length of all drawdowns.
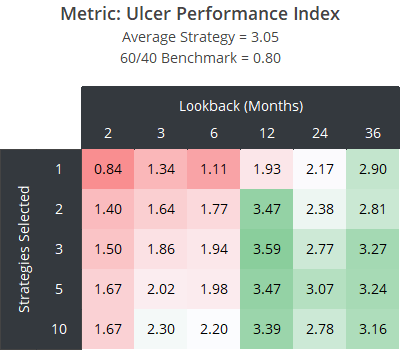
We were surprised by the high UPI produced with a 12-month lookback, even by smaller portfolios. The 3 strategy/12-month lookback portfolio produced a UPI of 3.59, compared to 3.05 for the average strategy.
That might appear enticing, but we chalk it up to mostly luck. The benefit of selecting strategies this way has been inconsistent over time and has been ineffective since 2011 (not shown for brevity). In a future installment of this series, we’ll share a modified approach that has been more consistently effective.
Reminder: These results do not account for all trading frictions:
A reminder from our previous analysis: these results account for trading frictions (transaction costs + slippage) in the individual strategy backtests, but do not account for the additional friction of switching between strategies. That means that actual results would have been worse than what we’ve presented here.
At the end of this multipart series, we may take the most promising approaches to strategy selection and apply this additional analytical step.
Bonus data: Removing the risk-free hurdle
As previously mentioned, when we select strategies with the highest recent Sharpe Ratio, we implicitly select for riskier strategies, because the Sharpe Ratio includes a risk-free hurdle (T-Bills).
What if we removed that hurdle, and simply selected strategies based on return relative to volatility? The results across our 4 metrics (click to zoom):
Removing the risk-free hurdle will tend to select strategies that are more conservative than the average strategy. That’s because it favors strategies that hold assets that perform more consistently month-to-month, like US Treasuries.
All other observations, however, hold.
Outro:
In short, selecting strategies based on recent Sharpe Ratio has been a better approach than selecting strategies based on recent return, but it has still been suboptimal. In a future post we’ll share a modified version that has been more effective.
Our advice for selecting strategies remains the same:
Select a broad range of diverse, robust, high-quality strategies. Consider avoiding strategies that have significantly underperformed their own historical expectations until performance is better understood (see the Underperformer Watchlist), but beyond those extreme cases, do not consider recent performance in strategy selection.
As mentioned, this is the second article in a multipart series. Be on the lookout for additional tests in the coming weeks.
New here?
We invite you to become a member for about a $1 a day, or take our platform for a test drive with a free membership. Put the industry’s best tactical asset allocation strategies to the test, combine them into your own custom portfolio, and follow them in real-time. Learn more about what we do.
