• Skip to primary navigation
  • Skip to main content
  • Skip to primary sidebar
  • Skip to footer

Allocate Smartly

  • About
    • What We Do
    • List of Strategies
    • Advanced Features
    • 19 Core Ideas
    • FAQs
    • Contact Us
  • Subscribe
  • Blog
  • Members

Tactical Asset Allocation in June

July 3, 2017

This is a summary of the recent performance of a wide range of excellent tactical asset allocation strategies. These strategies are sourced from books, academic papers, and other publications. While we don’t (yet) include every published TAA model, these strategies are broadly representative of the TAA space. Read more about our backtests or let AllocateSmartly help you follow these strategies in near real-time.

Recent Performance of Asset Allocation Strategies
Use the Arrows to Sort This Table
Strategy June YTD
Faber’s Global Tactical Asset Alloc. – Agg. 6 1.67% 7.42%
Stoken’s Active Combined Asset 1.20% 5.95%
Glenn’s Paired Switching Strategy 0.79% 9.12%
Robust Asset Allocation – Aggressive 0.69% 9.40%
Philosophical Economics’ Growth-Trend Timing 0.64% 9.17%
Varadi’s Percentile Channels 0.62% 2.79%
Robust Asset Allocation – Balanced 0.57% 3.66%
Faber’s Global Tactical Asset Alloc. – Agg. 3 0.53% 2.95%
US Risk Parity Trend Following 0.51% 1.85%
Elastic Asset Allocation – Defensive 0.49% 9.15%
PortfolioCharts’ Golden Butterfly 0.45% 4.73%
Traditional Dual Momentum 0.44% 8.96%
Faber’s Ivy Portfolio 0.36% 4.04%
Flexible Asset Allocation 0.34% 4.01%
Protective Asset Allocation – CPR 0.33% 5.58%
US Min Correlation 0.31% 5.17%
US Equal Risk Contribution 0.31% 4.54%
US Max Sharpe 0.27% 6.48%
Global Risk Parity Trend Following 0.24% 3.01%
Dalio’s All-Weather Portfolio 0.21% 5.49%
Faber’s Global Tactical Asset Alloc. 13 0.21% 3.86%
60/40 Benchmark 0.18% 6.45%
Composite Dual Momentum 0.16% 9.00%
Varadi’s Minimum Correlation Portfolio 0.13% 8.98%
Faber’s Global Tactical Asset Alloc. 5 0.10% 2.72%
Novell’s Tactical Bond Strategy 0.07% 1.81%
Protective Asset Allocation 0.03% 6.41%
Keuning’s Generalized Protective Momentum -0.06% 4.65%
Elastic Asset Allocation – Offensive -0.11% 9.06%
US Max Diversification -0.11% 4.76%
Classical Asset Allocation – Offensive -0.16% 13.37%
Browne’s Permanent Portfolio -0.18% 5.84%
Adaptive Asset Allocation -0.22% 6.02%
Classical Asset Allocation – Defensive -0.25% 8.36%
Tactical Permanent Portfolio -0.51% 6.01%
Davis’ Three Way Model -0.83% 7.48%
Faber’s Sector Relative Strength -1.46% 3.25%

Commentary:

Tactical asset allocation turned in a mixed performance in June. Risk assets were mostly up for the month, including US small caps (ex. IWM and IWN, both +3.4%), US real estate (VNQ, +2.2%) and most international markets, but there were select exceptions like QQQ (-2.3%) and international real estate (RWX, -1.7%). Significant diversifying assets like commodites (DBC, -1.0%) and gold (GLD, -2.2%) performed poorly.

The following two charts help to show trends in the asset classes that TAA is allocating to over time. The first chart shows the average allocation over the last two years to broad categories of assets by the 37 strategies that we track, as of the end of each month (for a longer view, see this post). For example, “US Equities” may include everything from the S&P 500 to individual stock market sectors.

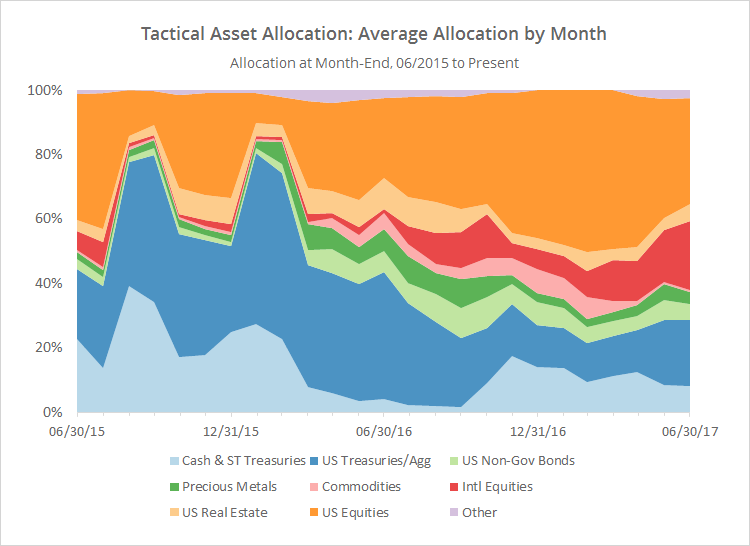
The most significant new observation from this chart is the continued rotation out of US equities (orange) and into international equities (red). Average exposure to international equities now stands at 21%, a level not seen since the end of 2012.

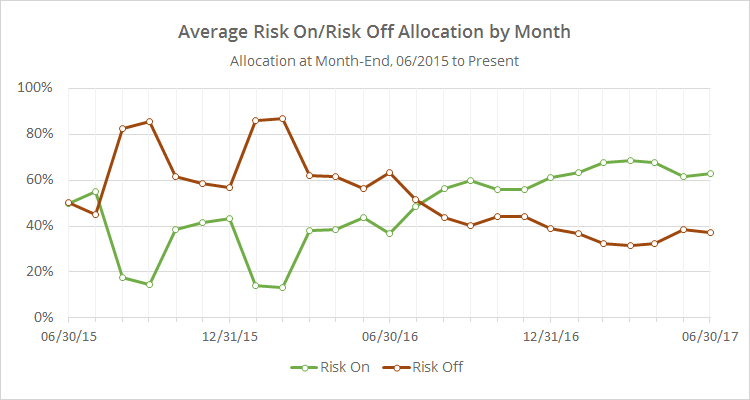
Below we’ve combined the average TAA allocation into even broader categories: “risk on” (equities, real estate and high yield bonds) versus “risk off” (everything else). I realize that some asset classes don’t fit neatly into these buckets, but it makes for a useful high level view. Overall allocation to risk assets remains near historical highs. That’s great if this broad rally continues, but there is significant exposure to investors here if the market stumbles in July.

We invite you to become a member for less than $1 a day or take our platform for a test drive with a free limited membership. Track the industry’s best tactical asset allocation strategies in near real-time, and combine them into custom portfolios. Have questions? Learn more about what we do, check out our FAQs or contact us.

Filed Under: TAA Performance

Previous Post
Next Post

Primary Sidebar

About Us

We have built a platform to track the industry's best Tactical Asset Allocation strategies in near real-time, and combine them into custom portfolios.

Learn about what we do or take our platform for a free test drive.

Follow Our Blog

Recent Posts

  • Front-Running Seasonality in Country ETFs: An Extended Test
  • New Feature: Walked-Forward Optimal Strategy Combinations (aka “Meta Walk-Forwards”)
  • Walking Forward Optimal Strategy Combinations
  • Taming Excessive “Timing Luck” in TAA by Tranching Strategies
  • Piard’s Annual Seasonality

Categories

Footer

About Us

We have built a platform to track the industry's best Tactical Asset Allocation strategies in near real-time, and combine them into custom portfolios.

Learn about what we do and take our platform for a free test drive.

New from Our Blog

  • Front-Running Seasonality in Country ETFs: An Extended Test April 29, 2025
  • New Feature: Walked-Forward Optimal Strategy Combinations (aka “Meta Walk-Forwards”) April 22, 2025
  • Walking Forward Optimal Strategy Combinations March 31, 2025

Helpful Links

  • What We Do
  • List of Strategies
  • Advanced Features
  • Subscribe
  • Blog
  • FAQs
  • Contact Us
  • Member Login

Stay Informed

Follow the latest research from our blog via Twitter, RSS and email:

© 2025 Allocate Smartly. All rights reserved.
  • Affiliates
  • Terms of Service
  • Privacy