This is a test of a Risk Premium Value strategy (RPV) that allocates to major US asset classes based on current risk premium valuations relative to historical norms. Readers will note the similarity between RPV and other related strategies, such as CXO Advisory’s SACEVS.
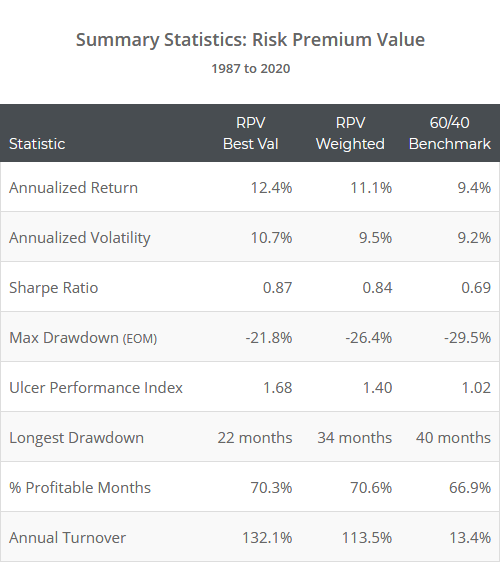
Backtested results from 1987 net of transaction costs follow (see backtest assumptions). Results are shown in two flavors: Best Value (orange) and Weighted (blue). Learn more about what we do, and follow RPV and 60+ other asset allocation strategies in near real-time.

Logarithmically-scaled. Click for linearly-scaled results.
The strategy has outperformed the ubiquitous 60/40 on both an absolute and risk-adjusted basis, but it hasn’t performed as well as many tactical strategies that we track. Despite that, we think that it still has value as part of a diversified tactical portfolio. More on that in a moment.
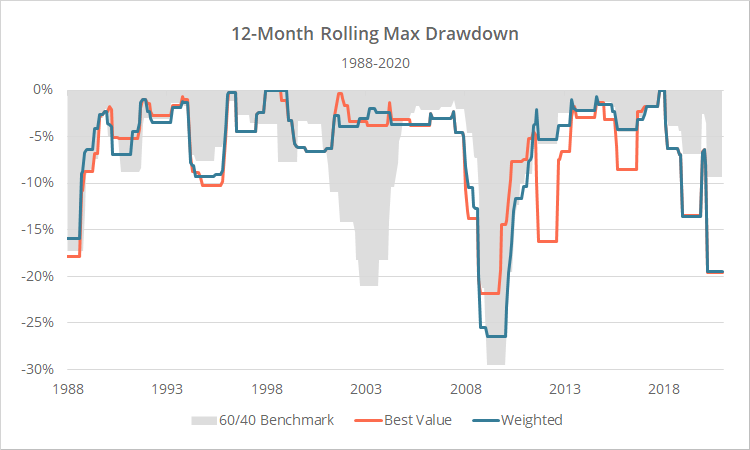
Readers are accustomed to seeing a max drawdown curve next, but trying to show three drawdown curves in one chart would look like a pile of spaghetti. We’ve instead shown the 12-month rolling max drawdown.
Note how RPV has struggled with effective drawdown control. To some degree, that’s to be expected. Most strategies that we track are based on price alone and designed to quickly reduce exposure during downturns. By its nature, RPV is less responsive to changes in price, and risk premiums may actually grow more undervalued as prices fall.
Why this strategy is important:
Most of the tactical strategies that we track employ some variation of trend-following and momentum. That makes sense. Both have been effective approaches to timing financial markets for essentially as long as financial markets have existed. But many of these strategies are only different “at the margins”. The fundamental observation being traded (to oversimplify: asset classes going up tend to continue going up), is the same.
RPV takes an entirely unrelated approach; it’s a value strategy. As an asset’s price increases, the asset tends to become less attractive.
While in the long-term, both RPV and trend-following/momentum have been successful, in any given month they will often take very different positions. One will often zig while the other zags. By combining the two, we gain an additional degree of diversification compared to combining strategies that all exploit the same core observation (in other words, it’s “diversification of the how”).
So, while RPV’s backtested results may not be as good as many other strategies we track, the unique return stream could help to smooth out returns when used as a component of a broader portfolio.
Strategy rules tested:
Note: RPV trades on the last trading day of each month, but members can use our platform to follow the strategy on any other day of the month as well.
- At the close on the last trading day of the month, measure the risk premium (RP) associated with each of 3 asset classes. The ETF traded to represent each asset class is in parenthesis:
- US Treasuries (TLT): Difference between long and short-term US Treasury yields.
- US Corporate bonds (LQD): Difference between US investment grade corporate bond and long-term US Treasury yields.
- US Equities (SPY): Difference between the S&P 500 earnings yield and long-term US Treasury yield. Earnings are lagged by at least 4 months to ensure data availability.
- Normalize each RP to determine how over/undervalued the RP is relative to historical norms. To do this, we determine how many standard deviations each RP lies above (undervalued) or below (overvalued) its mean value, from inception of our data to that point in time (no lookahead).
- RPV Best Value selects the single asset class with the highest normalized RP. If the normalized RP is positive (i.e. undervalued relative to history) we allocate 100% of the portfolio to that asset class at the close. If the normalized RP is <= 0, we instead allocate to cash.
- RPV Weighted allocates proportionally to all asset classes with a positive normalized RP at the close. If the normalized RP for all asset classes is <= 0, it instead allocates the entire portfolio to cash. Note: RPV Weighted will often still hold very concentrated positions (ex. it’s currently 100% allocated to SPY).
- All positions are held until the end of the following month. The portfolio is assumed to be rebalanced monthly.
Important: We’re normalizing each RP based on data from inception to that point in time. That makes strategy results dependent on the inception date used. Had we started the test 1 year later, results throughout the test would have been different because the mean/sd used to normalize the RPs would have also been different.
That adds a larger than usual helping of potential overfitting to these results, but based on our tests of other alternatives (using other nearby start dates, using trailing n-years instead of all data) the strategy is still broadly effective regardless of the approach used.
How close are these results to CXO’s SACEVS?
This is not a replication of SACEVS. They are both exploiting risk premium valuation though, so results are inevitably similar.
Because we know members will ask, correlation in annual returns for RPV vs SACEVS exceeds 98% based on public data provided by CXO. Total returns during the overlapping period tested are also very similar.
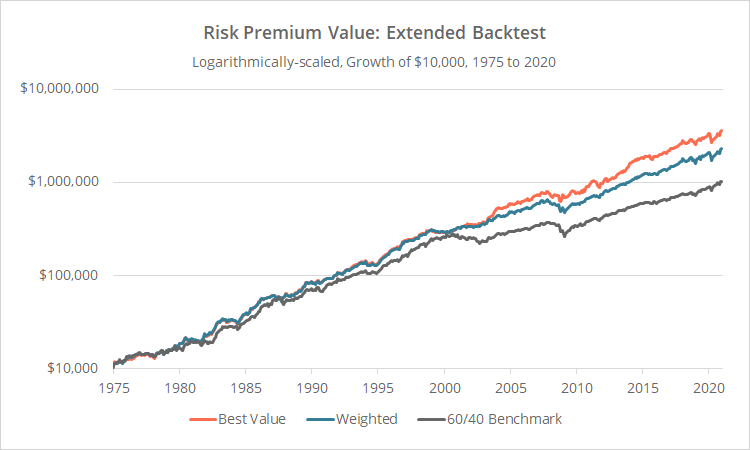
Extending our backtest to 1975:
In the test above, the yield data used by the strategy is lagged by up to 2-days due to delays in data reporting. By dropping that lag requirement prior to 1987, we’re able to extend these results back to 1975. Doing so allows us to rely on monthly (rather than daily) asset data, and as is often the case, monthly asset data is available further back in history (read more).
These results are implicitly less accurate. Having said that, we would expect correctly lagged results to be very close to this, because the lag caused little change in strategy results in our shorter test.

Logarithmically-scaled. Click for linearly-scaled chart.
This extended test makes clear that prior to the turn of the century, RPV did not provide as significant an advantage over the 60/40 benchmark.
From 1975-1999, annualized returns were similar (13.8%, 13.9% and 13.3% for Best Value, Weighted and 60/40), as were other key stats like Sharpe Ratio (0.64, 0.67, 0.59) and max drawdown (-13.0%, -13.5%, -17.3%).
Most of the advantage of RPV has come since the turn of the century. That’s relatively recent history by TAA standards, and a reason to temper expectations of future performance.
Our take on Risk Premium Value:
We’ll repeat our previous observation because we think it’s the most important take-away for RPV:
Most of the tactical strategies that we track employ some variation of trend-following and momentum. Those strategies tend to only be different “at the margins”. RPV on the other hand is an entirely unique strategy. That means that, despite not exhibiting the same degree of historical performance, it still may have value as a diversifier when part of a broader tactical portfolio.
New here?
We invite you to become a member for about a $1 a day, or take our platform for a test drive with a free limited membership. Put the industry’s best tactical asset allocation strategies to the test, combine them into your own custom portfolio, and follow them in near real-time. Not a DIY investor? There’s also a managed solution. Learn more about what we do.


