This is a follow up to our previous post. Same subject, additional data.
Both stocks and government bond funds have suffered major losses this year. Stocks and gov bonds form the core of most portfolios. Gov bonds tend to counterbalance risk assets, helping to smooth returns during periods of market stress. But so far this year, they’ve failed to deliver when needed.
Big drawdowns in risk assets are to be expected. Tactical Asset Allocation is specifically designed to manage that risk. But the simultaneous failure in both risk assets and bonds this year is far, far outside of historical norms. That 1-2 punch has been a major challenge for TAA strategies.
US Treasuries (all data updated 05/12):
It has been 90 trading days since the S&P 500 (represented by SPY) experienced its last all-time closing high on 01/03/2022. Since that time, SPY is down -17.6%. Over that same period, intermediate-term US Treasuries (IEF) are down -9.1%.
Geek note: We’re using IEF as our proxy for government bonds, but the same basic conclusions would hold for longer (ex. TLT) or shorter (ex. IEI) durations, and for most international gov bonds (ex. BWX).
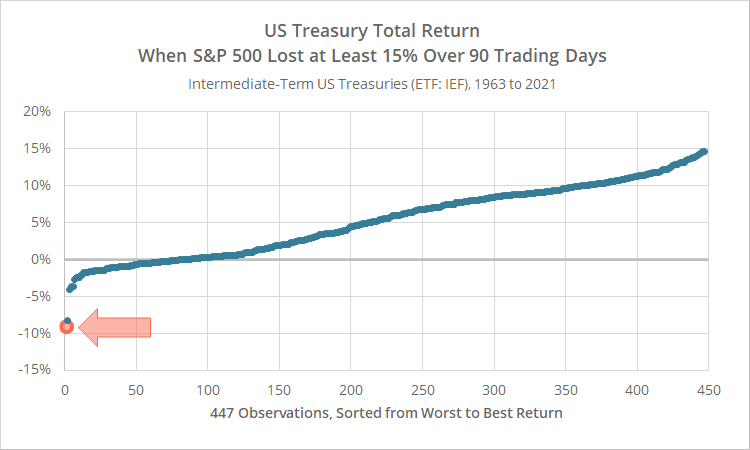
There were 447 (overlapping) instances between 1963 and 2021 when the S&P 500 lost at least -15% over 90 trading days. In the graph below, we’ve plotted returns for US Treasuries over each of those periods, sorted from worst to best.
The orange datapoint represents US Treasury returns in the current 90-day period.
When the S&P 500 fell at least -15%, US Treasuries were up in 81% of the time, with an average return of 5.2%. In only one instance did US Treasuries perform as poorly as they are currently (10/19/1987, -8.2%).
The comparison is a little misleading though, because for most of this 60-year period Treasury yields were significantly higher than they are today. That higher yield acted as a cushion against the short-term impact of rising interest rates (read more).
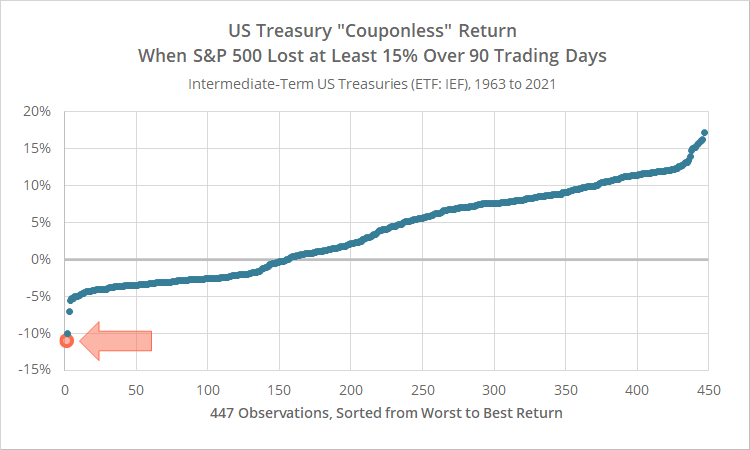
In the graph below we’ve accounted for that by showing the performance of a hypothetical “couponless” US Treasury. By ignoring the coupon, we’re only measuring the impact of changes in interest rates over the 90-day period. That makes for more of an apples-to-apples comparison with the current environment.
Our couponless Treasury investment was up in 65% of instances, with an average return of 3.7%. Again, our current 90-day period (orange data point) is still far outside of historical norms. The high coupon of the past and low coupon of today doesn’t explain the abysmal performance in Treasuries this year.
Flipping the analysis: Performance of stocks when bonds are weak
Up to this point we’ve pointed the finger at gov bonds for not counterbalancing losses in stocks. What if we flip the analysis and ask, how well do stocks usually offset losses in gov bonds?
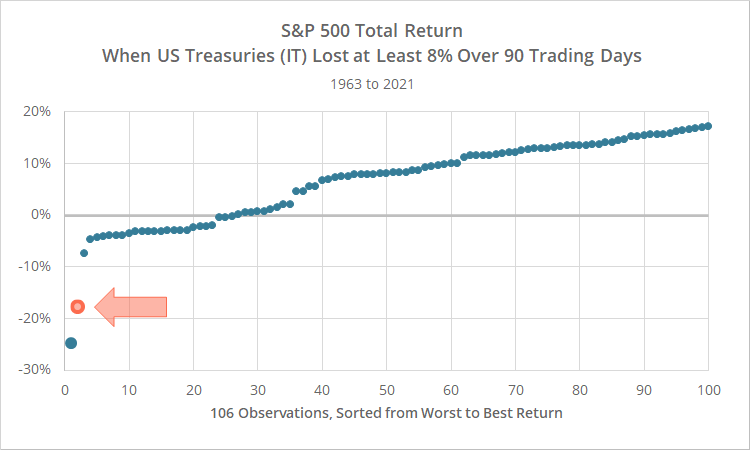
There were 106 instances between 1963 and 2021 when US Treasuries lost at least -8% over 90 trading days. In the graph below, we’ve plotted returns for the S&P 500 over each of those periods, sorted from worst to best.
The orange datapoint represents the S&P 500 return in the current 90-day period.
When US Treasuries were down at least -8%, the S&P 500 was up 75% of the time, with an average return of 7.1%. Again, what we’ve experienced this year is way outside historical norms. There was only one instance where the S&P 500 performed worse than it is currently (10/19/1987, -24.8%).
Other bond assets: Corporate bonds and TIPS
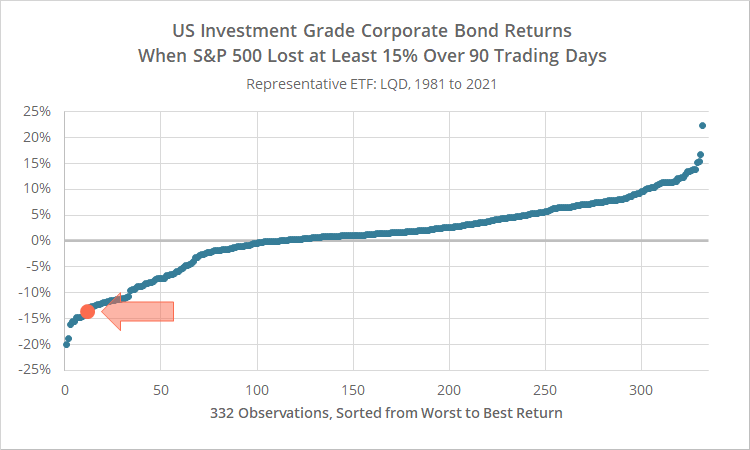
Other bond alternatives to conventional US Treasuries have also suffered big losses this year. Not quite to the same abysmal degree, but still much worse than historical averages.
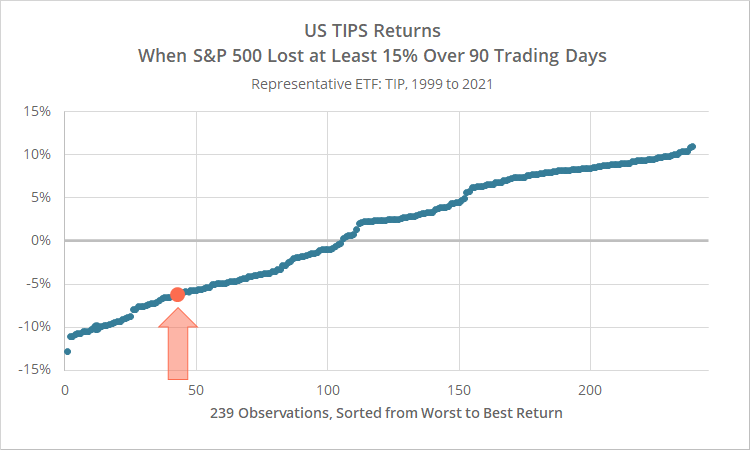
Below we look at instances when the S&P 500 lost at least -15% over 90 trading days, and the concurrent performance of US investment grade corporate bonds (represented by LQD) and US TIPS (TIP) over each of those periods, sorted from worst to best.
There haven’t been many places to hide from losses in stocks and other risk assets.
What asset classes have worked (or at least held their value)? Gold and commodities, cash and very short duration bond funds like BIL, and some defensive plays outside of conventional asset allocation like currencies and long volatility.
Impact on Tactical Asset Allocation:
Tactical Asset Allocation is designed to manage losses in stocks and other risk assets, and government bonds are the most important tool in TAA’s toolbox for doing so. The simultaneous failure in both risk assets and gov bonds has been a major challenge for TAA strategies.
As a result, TAA strategy performance has varied widely this year. The defining characteristic between strategies that have been successful and those that have not is how they treat gov bonds. Are gov bonds a reliable defensive asset that will always be there when risk assets fail? Or are gov bonds an inconsistent diversifier that we should also manage just like we do risk assets?
We attempt to capture that type of qualitative information for members with our Exposure to Rising Interest Rates report. If you haven’t done so already, we suggest reviewing the report to ensure you’re comfortable with the level of exposure for each strategy you’re following.
Note that we recently performed a complete audit of the qualitative values in the report, and the final scores for some strategies were affected. The biggest movers to note are the pair of “Risk Premium Value” strategies.
We’re also working on adding the ability to limit exposure to high interest rate risk strategies in the Portfolio Optimizer. Expect to see that in the coming month.
New here?
We invite you to become a member for about a $1 a day, or take our platform for a test drive with a free membership. Put the industry’s best tactical asset allocation strategies to the test, combine them into your own custom portfolio, and follow them in real-time. Learn more about what we do.
