Edit 03/18: This situation is getting sufficiently scary, in a way that transcends investing, that we’re going to slow down these periodic updates. Based on how TAA entered the month it should be pretty easy to extrapolate where returns stand now. Will post our next update at the end of this week. Stay safe out there.
Broadly speaking, Tactical Asset Allocation has weathered this storm reasonably well, but the last two days have been tough and we are by no means out of the woods.
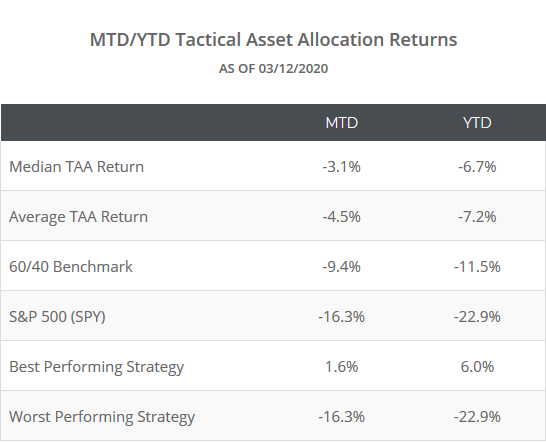
We track 50+ published TAA strategies, allowing us to draw some broad conclusions about TAA as a style. In the table below we show the MTD/YTD returns of these 50+ strategies:
TAA began reducing exposure to risk assets back in January, and entered March allocated 76% to defensive assets like treasuries and gold. Read more.
Up until two days ago, that was enough and TAA was largely up/flat for the month. Over the last two days however, those defensive assets have not provided enough lift to counterbalance losses in risk assets like stocks and real estate.
Interestingly, the strategies that have been the top performers in the past are also faring the best in this crisis. Whether that’s just by chance because they’re designed in such a way that just so happens to match this particular crisis, or whether we’re seeing the reason for their historical success live in real-time, is difficult to say.
TAA will likely reach peak defensiveness by the end of this month barring a massive market turnaround (read more). A big question for TAA is what this bottom eventually looks like. If TAA goes max defensive at month-end, and there’s a subsequent sharp recovery, TAA will be left out of that recovery or worse. TAA is heavy longer duration US Treasuries at the moment. Given recent volatility in yields, I could see TAA taking significant losses on those in a big market bounce.
For an aggregate view of the average allocation across TAA as a whole, updated daily, see the Aggregate Asset Allocation report. We’ve made the report available to free users as well through this crisis.
Stay safe out there.