A number of members have asked us to test the two aggressive versions of Meb Faber’s GTAA strategy from his seminal paper: A Quantitative Approach to Tactical Asset Allocation. I can’t overstate the importance that Faber’s work has had in popularizing the idea of TAA with the general investing community, and I highly recommend the read.
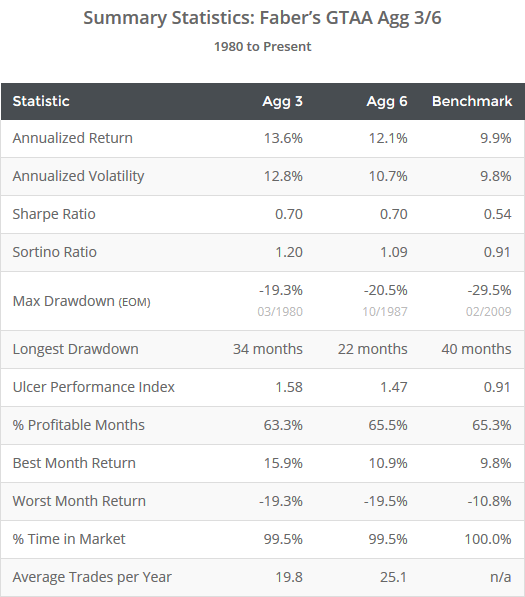
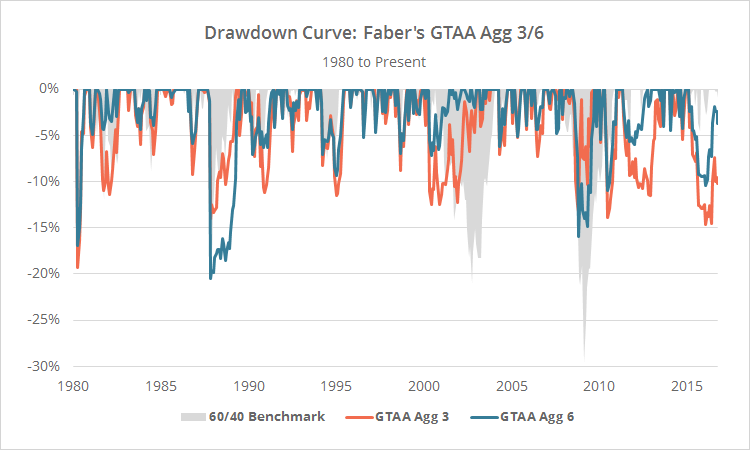
Faber’s strategy utilizes both relative momentum (asset returns relative to other assets) and absolute momentum (asset returns relative to itself), to take concentrated positions in a diverse basket of global asset classes. Results from 1981 follow for the Agg 3 (orange) and Agg 6 (blue) versions of the strategy. Results include transaction costs. Read more about our backtests or let AllocateSmartly help you follow this strategy in near real-time.
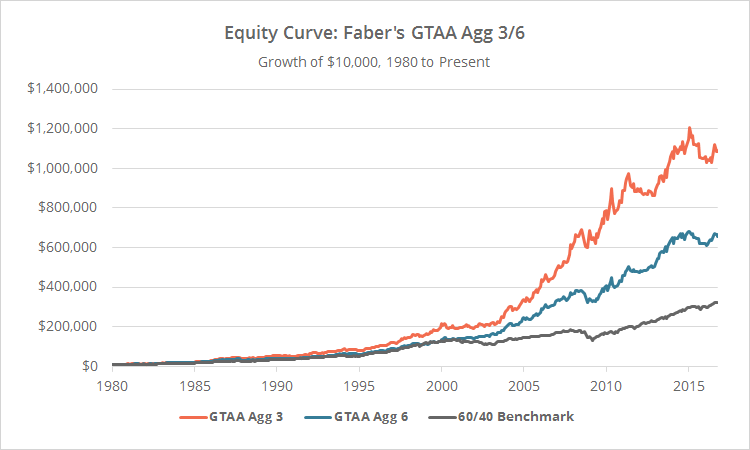
Linearly-scaled. Click for logarithmically-scaled chart.
Eagle-eyed readers will note that these results, while very good, are considerably less optimistic than those presented in the original paper. More on this in a moment.
The only differences between the Agg 3 and Agg 6 versions of this strategy are the number of assets held and the amount allocated to each. The Agg 3 version holds 3 assets at any given time with 1/3 of the portfolio allocated to each, and the Agg 6 version holds 6 assets with 1/6 allocated to each.
Strategy rules tested:
- At the close on the last trading day of the month, calculate the 1, 3, 6, and 12-month returns for each of 13 global asset classes. See end notes for a list of assets traded.
- Calculate the average of the four values above for each asset class.
- Go long the 3 (or 6) asset classes with the highest average value (relative momentum), unless that asset will close below its 10-month moving average, in which case that portion of the portfolio is allocated to cash (absolute momentum).
- Hold positions until the final trading day of the following month. Rebalance the entire portfolio monthly, regardless of whether there is a change in position.
Commentary:
Readers familiar with Faber’s original GTAA 13 strategy will note that these aggressive versions have the ability to take much more concentrated positions than the original. While the original GTAA 13 maintained control over the percentage of the portfolio any particular category of assets could consume, these aggressive versions often become highly concentrated in a single category (ex. all equities). When the strategy times the markets well, this will of course boost performance, but it also increases the risk of significant loss (it’s not called “aggressive” for nothing).
Agg 3 is the more concentrated of the two, and as one would expect, has exhibited the higher volatility. All things considered however, both have performed similarly in terms of risk-adjusted metrics like Sharpe, Sortino, and UPI.
This strategy employs both relative and absolute momentum, but relative momentum is by far the more significant. Because this strategy is selecting the best performing assets from a larger basket, assets chosen will tend to also be above their long-term trend, meaning that the absolute component of the strategy only affects results on about 5% of months for the Agg 3 version, and 20% of months for Agg 6.
Less optimistic results:
These results, while very good, are considerably less optimistic than those presented in the original paper. That’s partially a result of the addition of transaction costs, but even if we assumed costs to be zero, our annualized returns would still fall short by 2.6% (Agg 3) and 3.7% (Agg 6) during overlapping years.
The difference is largely the result of using more accurate proxies to simulate ETF data prior to each ETF’s launch. The original paper used Fama-French data to represent equity asset classes which, as shown here, often provides an overly-optimistic view of asset class returns. When running the test without transaction costs and with Fama-French data, our returns are similar to those in the original paper.
Note that this is not intended as a slight on Faber’s excellent work. A lot of research in TAA has been performed on this type of data.
Alternate trading days:
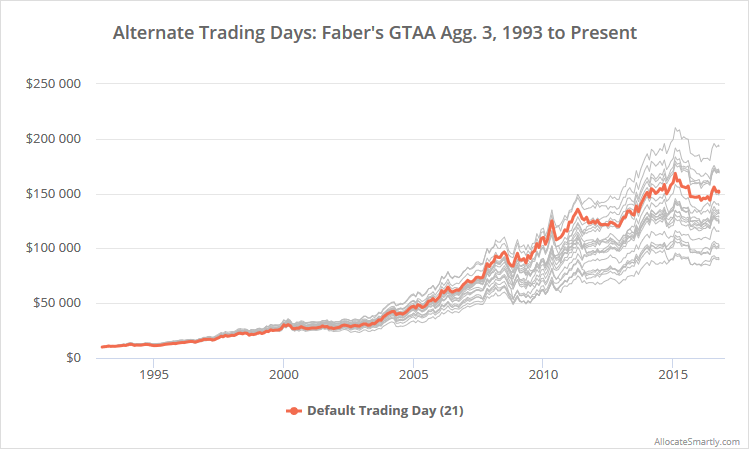
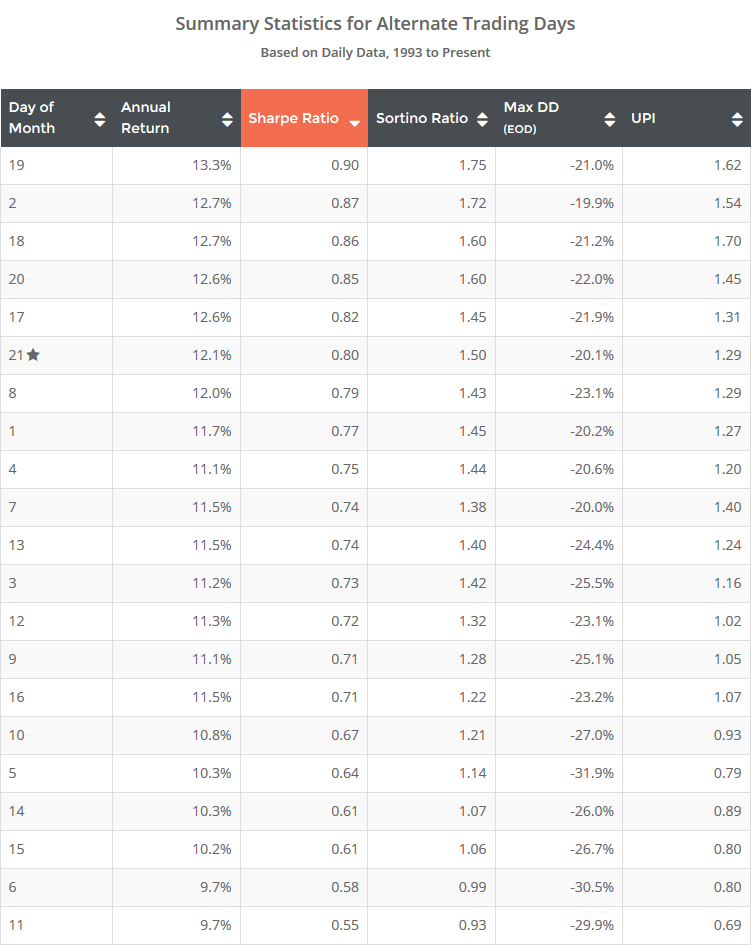
As previously discussed, our members section includes the results of trading month-end strategies (like this one) on other days of the month as well. Below I’ve shown results trading Agg 3 on alternate trading days. Remember, day 21 represents the last trading day of the month. Click to zoom.
The fact that day 21 is middling relative to all trading days, and the fact that it is has performed similarly to nearby days, gives me a degree of confidence that this strategy is not overfit to specifically monthly interval data.
End notes:
A list of assets traded: US large-cap value (represented by IWD), US large-cap momentum (MTUM), US small-cap value (IWN), US small-cap equities (IWM), international equities (EFA), emerging market equities (EEM), intermediate-term US Treasuries (IEF), international treasuries (BWX), US corporate bonds (LQD), long-term US Treasuries (TLT), commodities (DBC), gold (GLD), and real estate (VNQ).
Calculation notes:
- The strategy calls for a US small-cap momentum asset. Such an ETF does not exist that meets our criteria for inclusion, so we’ve replaced it with IWM (Russell 2000, US small-caps).
- The strategy does not include EEM (emerging markets) prior to 1989, or BWX (international treasuries) prior to mid-2002, due to a lack of accurate historical data.
