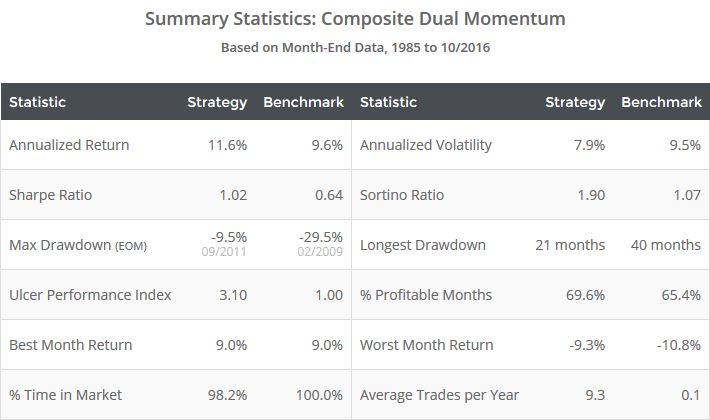
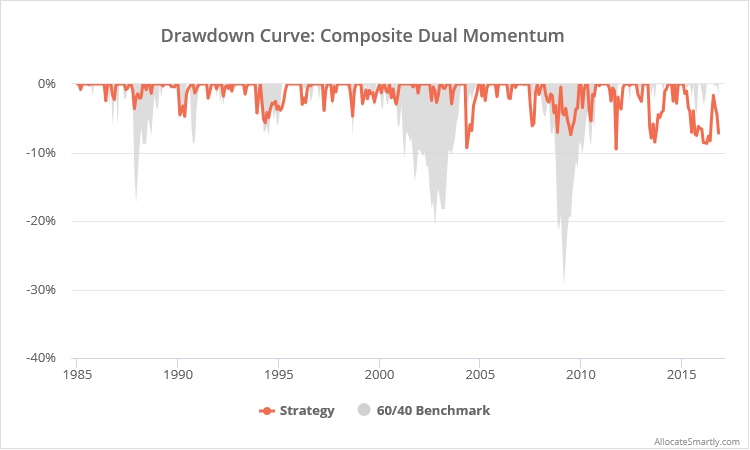
This is a test of “Composite Dual Momentum”, broadly based on Gary Antonacci’s paper: Risk Premia Harvesting Through Dual Momentum. The model uses Antonacci’s unique approach to measuring momentum, which considers both absolute (aka time-series) and relative (aka cross-sectional) momentum, to trade a much larger basket of asset classes than his more well-known Traditional Dual Momentum strategy. Results from 1985, net of transaction costs, follow.
Read more about our backtests or let AllocateSmartly help you follow this strategy in near real-time.
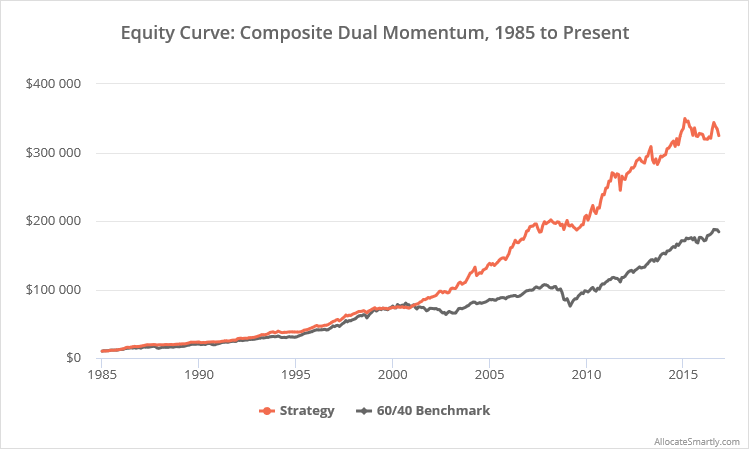
Linearly-scaled. Click for logarithmically-scaled chart.
The strategy divides the portfolio into four “modules”, each targeted to a different component of financial markets: equities, credit risk, real estate, and stress. From each module, the strategy uses dual momentum to select either one of two related asset classes, or cash. The four modules and their associated assets are as follows:
- Equities: US equities (represented by SPY) or international equities (EFA)
- Credit risk: US corporate bonds (LQD) or US high yield bonds (HYG)
- Real estate: equity REITs (VNQ) or mortgage REITs (REM)
- Economic stress: gold (GLD) or long-term US Treasuries (TLT)
There are subtle differences in the assets we’ve chosen to represent each asset class versus those in Antonacci’s original test, but they are substantially similar. Generally-speaking, our goal is to best represent strategies using large, liquid assets available today. See the end notes for additional details about this test, and see our FAQs for backtest assumptions.
Strategy rules tested:
- At the close on the last trading day of the month, calculate the 12-month return of each of the eight asset classes shown above, plus 3-month US Treasuries (BIL).
- Divide the portfolio into four equally-sized modules (25% allocated to each). For each of the modules, determine the asset with the highest 12-month return (relative momentum). If that asset’s return exceeds the 12-month return of BIL (absolute momentum), go long that asset at the close, otherwise move to cash.
- Hold positions until the final trading day of the following month. Rebalance the entire portfolio monthly, regardless of whether there is a change in position.
Commentary:
Antonacci’s Composite Dual Momentum has been one of the top performing strategies that we track in terms of risk-adjusted return (Sharpe, Sortino and UPI).
That’s partially a result of the “dual momentum” approach to trading and the diversification inherent to trading a broad basket of asset classes. Less obviously, it’s also because the strategy maintains the size of each “module”, even when that module is in cash. If the strategy were to instead, for example, divide the portfolio among whatever asset classes happened to be long, it would be more likely to become concentrated in tangentially-related asset classes, like equities and real estate (reducing the Sharpe Ratio in our test from 1.02 to 0.75 and UPI from 3.10 to 1.80, with no improvement in annualized return).
I should note that Antonacci recommends the Traditional Dual Momentum strategy (which is nearly identical to the “equity module” described above) over this more diversified composite strategy. Based on my conversations with Gary, his reasoning is that, historically, equities have enjoyed the highest risk premium (by far), so investors should seek to invest in them as much as possible. In his view, the other assets in a diversified portfolio are there to reduce the risk of an all stock portfolio, but absolute momentum does a better job of that without creating a drag on expected performance.
I’m completely agnostic as to which strategy investors see as “best” (if such an oversimplification is even possible), and I think that there’s a lot of value in the author’s line of thought. Having said that, I come to a different conclusion. In my view, the function of diversification (between both assets and between strategies) isn’t just about the stated goal of reducing risk through less than perfectly correlated return streams. It’s insurance against the unknown; an acknowledgement that we don’t know what we don’t know.
We don’t know whether we’re on the verge of a long drought where equities don’t enjoy the highest risk premium. And even more fundamentally than that, we don’t know whether any specific trading approach applied to any specific asset will continue to work as expected.
Throughout the market’s history, very consistent market observations have suddenly and without warning stopped working. Do I think momentum as a general concept will be one of those? No. Too many fundamental market forces are at work, and have been for literally hundreds of years of market history. But do I think that one particular approach (12-month dual momentum) applied to one specific asset class (US and international equities) is the best choice? I don’t know, and neither does anyone else. I see value in having access to as large a toolbox as possible, because diversification across both asset classes and strategies is insurance against that unknown.
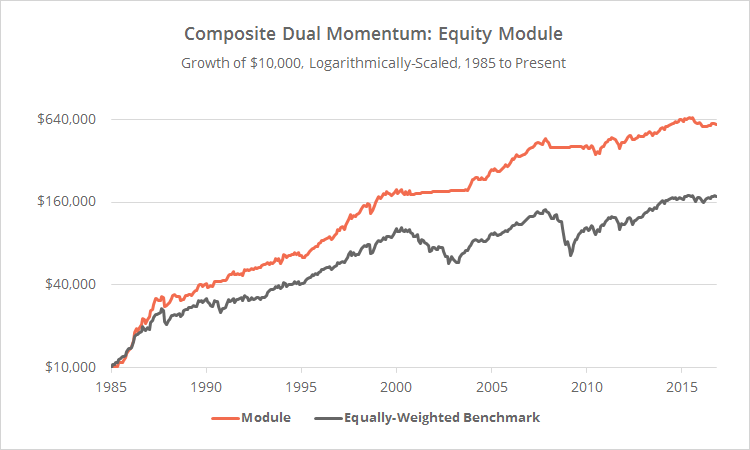
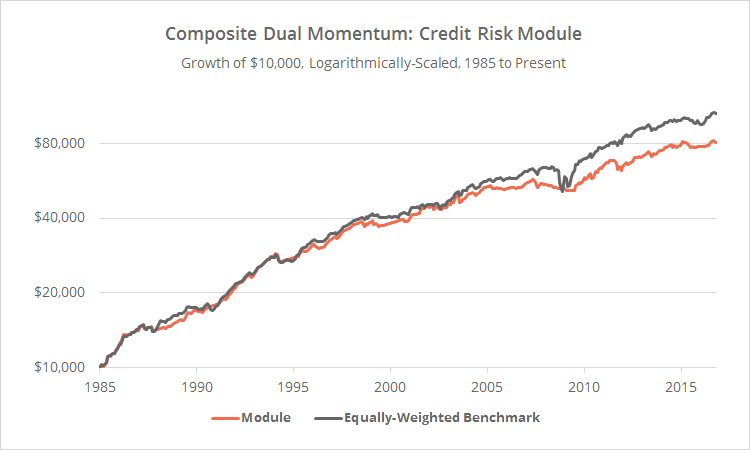
Breaking out individual modules:
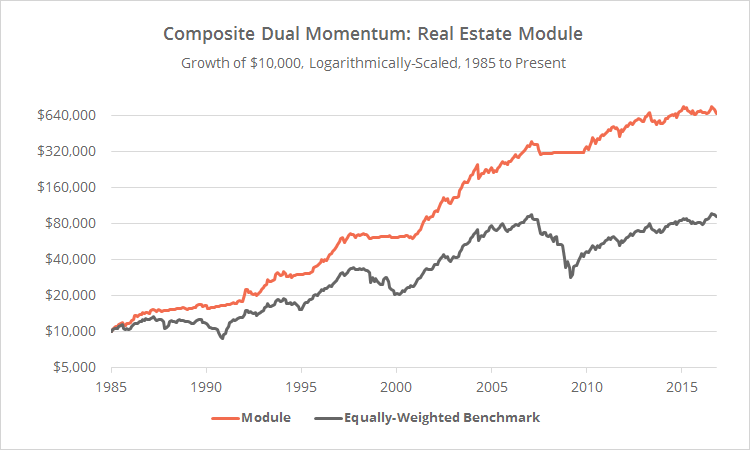
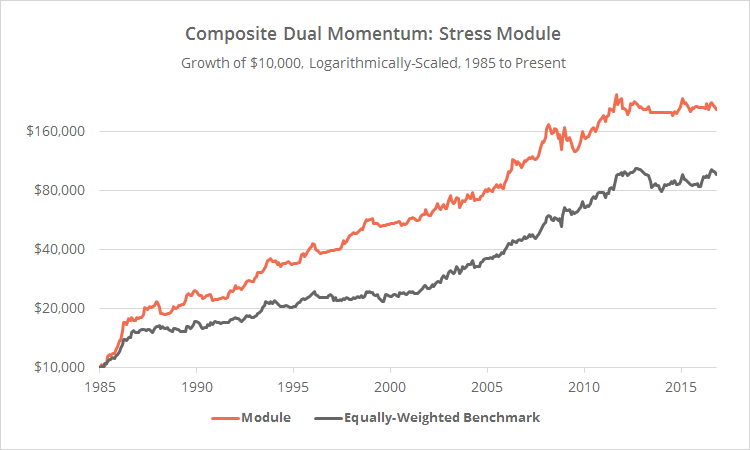
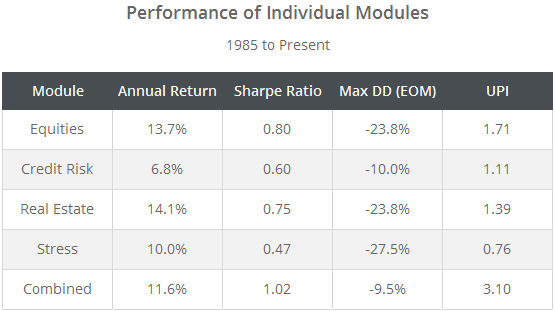
Below I’ve broken out the four individual modules as if they were traded as a standalone strategy, versus an equally-weighted benchmark rebalanced monthly (click charts to zoom). It’s interesting to note that the performance of some of the individual modules has been good but not stellar. The fact that the combined strategy has performed so well is an indicator of how well this particular universe of assets plays together.
End notes:
A note on the mortage REITs ETF REM:
This is the first time we’ve used REM on this site. REM is the only mortgage REIT ETF large and liquid enough to meet our criteria for inclusion. REM tracks the FTSE NAREIT All Mortgage Capped Index (Bloomberg ticker: FNMRC and TFNMRC). Historical data for that index does not extend very far into the past, so we’ve joined that data with the FTSE NAREIT Mortgage REITS Index (Bloomberg ticker: FNMR and FNMRTR). This longer index, though similar in spirit, hasn’t been a close enough match to meet our usual criteria for use, but unfortunately, we don’t have a better option. Given the diversification inherent to this strategy and the fact that REM traded far less often than VNQ, this likely didn’t have a huge impact on the backtest of the overall strategy, but we felt it worth mentioning. We take great pride in the quality of our historical data, and this is one case where that quality wasn’t up to our usual standards. Read more about simulated asset data.
