This is a test of a new paper from Dr. Wouter Keller titled Growth-Trend Timing and 60-40 Variations: Lethargic Asset Allocation (LAA). This is primarily a buy & hold strategy that’s roughly based on the classic “Permanent Portfolio”, but it includes an element of tactical asset allocation. This blending of buy & hold with tactical can be less stressful to trade, especially for investors who are sensitive to periods of relative underperformance.
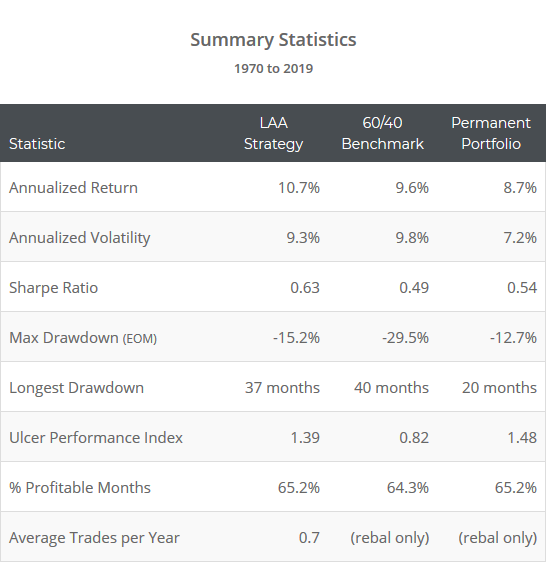
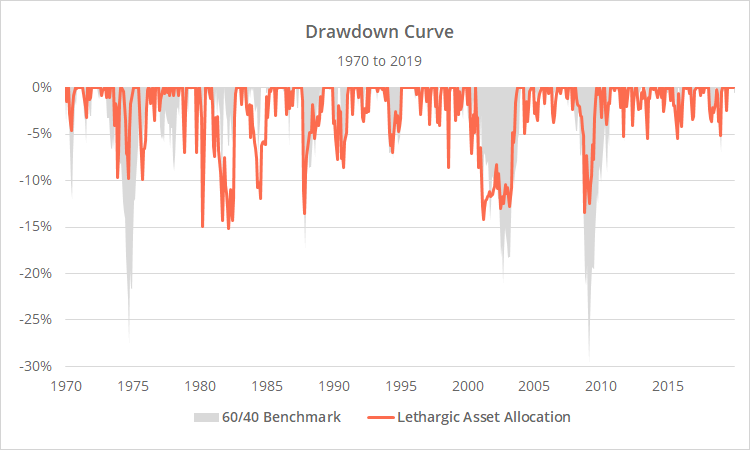
Strategy results from 1970 follow in orange, versus the 60/40 benchmark and Permanent Portfolio. Results are net of transaction costs – see backtest assumptions.
Learn about what we do and follow 50+ asset allocation strategies like this one in near real-time.
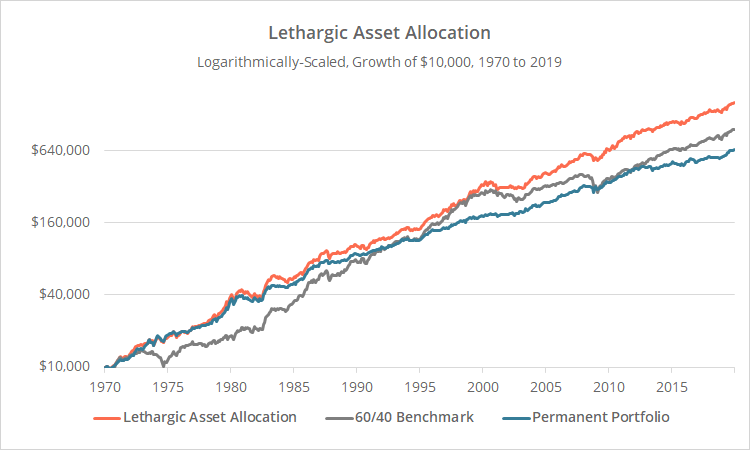
Logarithmically-scaled. Click for linearly-scaled chart.
As the stats below show, the strength of the strategy has been in managing losses, not generating big returns. That’s an important, but often underappreciated quality, especially during boom times like we find ourselves in now.
Drawdowns cause investors to abandon their best laid plans, usually at the worst possible moment by selling low. At the end of the day, the performance of a strategy only matters for the period of time that an investor actually sticks to it.
A digression on our own approach to investing:
We don’t want to get so bogged down in the nitty-gritty about LAA that we miss the key takeaway from this article. We’ll discuss LAA in more detail in a moment, but first, let’s have a brief discussion about our own approach to investing, and how it relates to what Dr. Keller has tried to do with LAA.
We believe that a portion of most investors’ wealth should be allocated to a smart buy & hold strategy. That might seem strange coming from a shop like ours, but it’s a belief born out of decades of investing in the real world. The reason? Significant short-term underperformance causes investors to do dumb things.
Investors say they want absolute returns, but most really want relative outperformance. Those are two very different goals. If you make 10%, but everyone else is up 20%, most investors are unhappy. If you make 10%, but everyone else is down 10%, most are happy. That runs counter to the pursuit of absolute returns which says I’m happy as long as I’m making a consistent 10% year in and year out.
During strong bull markets, buy & hold tends to outperform tactical, because anything other than long risk to the gills in suboptimal. During turbulent markets, tactical tends to outperform, because loss management is a core theme of TAA. If history is any guide, TAA wins out handily in the long-term, but that doesn’t matter if you’ve prematurely scrubbed your trading plan.
By balancing the two, we help to ensure that whatever market is presented to us, we don’t underperform so badly in the short-term, that we abandon our well-crafted long-term plan.
Other notes:
- If this doesn’t describe you then congratulations, you’re part of the small % of investors with the intestinal fortitude to completely ignore the broader market (but most cannot).
- This is essentially the same argument for balancing strategy vs asset risk.
- For another strategy that provides an all-in-one solution for blending buy & hold with tactical, see Movement Capital’s Composite Strategy.
- What is a “smart” buy & hold strategy? There are lots of conflicting opinions here. You’ll find our own solution for building better buy & hold portfolios at BetterBuyAndHold.com. We also track a handful of popular options here in our members area.
- What constitutes “other stuff”? All sorts of things that are beyond the scope of this discussion. It’s something in which you have a unique advantage. If you have it, you know it, because it’s been hard earned. Maybe that’s a unique skill for real estate or private investing, or (less likely) profitable short-term/day trading, to name a few.
- How LAA fits into this approach: LAA attempts to create an all-in-one balance between buy & hold and tactical. We might disagree on how to accomplish that – personally, we do it through BetterBuyAndHold plus Meta Strategy for our tactical exposure – but the end goal is the same.
Digression over. Back to the nitty gritty on LAA…
About Lethargic Asset Allocation:
LAA combines two good ideas.
- It starts with an allocation similar to the Permanent Portfolio, designed to weather a range of economic states:
- Equities for periods of prosperity
- Short-term Treasuries during recession
- Gold during inflation
- Longer-term Treasuries during deflation
- The problem is that the original Permanent Portfolio can be too light on risk during periods of growth, causing it to underperform badly. Momentum is a good antidote for that, ratcheting up risk when appropriate.
Strategy rules tested:
75% of the LAA portfolio is buy & hold:
- 25% US large cap value (IWD)
Note: Unlike the original, LAA tilts towards value. - 25% gold (GLD)
- 25% intermediate-term US Treasuries (IEF)
The final 25% is where the tactical exposure is added. Whereas the original Permanent Portfolio maintains permanent exposure to short-term Treasuries/cash, LAA dynamically switches between short-term Treasuries (defensive) (1) and the Nasdaq 100 (QQQ, offensive).
LAA determines when to switch that 25% of the portfolio using a tactical strategy that we’ve covered previously: Philosophical Economics’ Growth-Trend Timing – UE Rate. We would encourage you to read more about GTT, but in short, it’s a trend-following strategy that considers both the US unemployment rate and stock market.
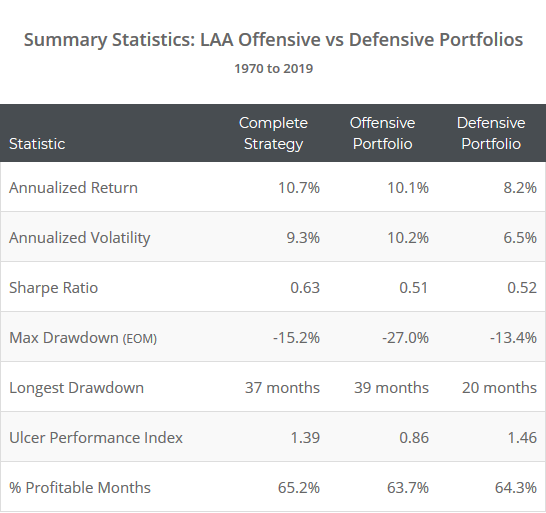
To demonstrate the effectiveness of that switching, below we’ve shown how a full-time allocation to either the offensive or defensive portfolios would have performed. Note the higher (lower) return/risk of the offensive (defensive) portfolios, and how LAA has been able to maintain the best attributes of both.
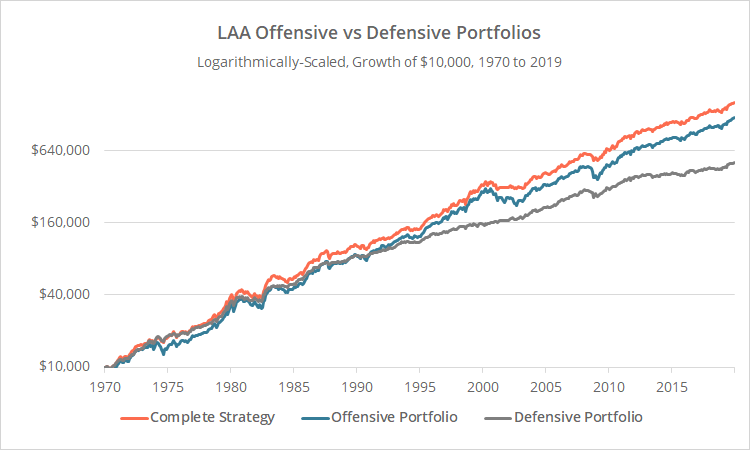
Logarithmically-scaled. Click for linearly-scaled chart.
We’ve assumed all trades were placed at the close on the last trading day of each month, and that the entire portfolio was rebalanced monthly even when there was not a change in position (matching the author’s test). (3)
Outro:
So that’s LAA. A simple strategy combining two good ideas: the Permanent Portfolio with added risk when appropriate.
Because LAA hasn’t put up the big sexy returns that other strategies we track have, we feared it might have gotten lost in the mix on our platform (we track a lot of models). So we wanted to take this post to talk about why combining buy & hold with tactical is a good idea, regardless of what the 30,000 foot view of the backtest shows.
Reasonable people can debate the best way to accomplish that (therein lies the magic), but we think LAA is certainly a reasonable approach.
A big thank you to Dr. Wouter Keller for his contribution. Unfortunately, Dr. Keller doesn’t have a website where you can follow him directly, but we encourage you to keep up with his releases on SSRN. He’s authored a number of papers on tactical asset allocation, including multiple strategies that we track here at Allocate Smartly.
New here?
We invite you to become a member for about a $1 a day, or take our platform for a test drive with a free limited membership. Put the industry’s best tactical asset allocation strategies to the test, combine them into your own custom portfolio, and follow them in near real-time. Not a DIY investor? There’s also a managed solution. Learn more about what we do.
End notes:
(1) The author uses the ETF SHY to represent short-term US Treasuries. As we do throughout this site, we’ve assumed that any trades signaled for SHY were instead placed in “cash” (equal to the 3-month UST rate). We feel it’s a more appropriate choice in today’s environment of low interest rates given transaction costs and the short period of time that the risk off portfolio is usually held. This change did not have a significant impact on historical results.
(2) Economic data, like the UE rate data used by this strategy, is often initially reported at one value and then later restated. That might happen multiple times before it finally settles on some permanent value. That could cause a discrepancy between the position shown in this test and what the strategy would have signaled in real-time. This is a risk inherent in trading based on economic data, and the results shown here are based on the data as it looks today. Having said that, Philosophical Economics did an excellent analysis of the long-term difference between trading based on initially reported values versus restated values. In short, while it could lead to a different signal in any given month (sometimes for the worse, sometimes for the better), those differences have balanced out over time and had little impact on long-term performance.
(3) Because of how infrequently this strategy trades, it could have been rebalanced much less frequently. Rebalancing only on either a change in position or at year end, would have resulted in an annual return of 11.0%, Sharpe Ratio of 0.64, and max drawdown -15.8% (essentially the same result). Annual portfolio turnover would have dropped from an already low 32% to just 22%.
(4) Results do not include US large cap value exposure (IWD) prior to 1975 due to a lack of accurate asset data. Prior to that year, we replaced IWD with “generic” US large cap exposure (SPY).
