Most Tactical Asset Allocation (TAA) strategies trade just once a month. Backtests of those strategies usually assume trades are executed on the last trading day of the month. Why? Monthly asset data is often available further back into history than daily data. Assuming trades are executed at month-end allows for longer backtests, showing how the strategy has performed in a wider variety of conditions.
A unique feature of our platform is the ability to follow these strategies on any other day of the month as well. We’re not simply executing the same signal on other dates; we’re recalculating the strategy’s entire position, while maintaining the integrity of the original strategy (read more).
The issue:
Most of the 50+ TAA strategies that we track have outperformed when traded on the last day of the month (as originally designed) versus other days. There are two competing reasons why:
- There’s something legitimately beneficial about trading on the last day of the month, and the performance boost is a result of that benefit. The day of the month matters. Or…
- It’s a byproduct of overfitting. Strategy authors designed these strategies on monthly data, and so any deviation from that will negatively impact backtested results because it cancels out the “benefit” of that overfitting. The day of the month does not actually matter.
Which is true? We’ve covered this topic previously here, here and here. In this post we dive deeper with additional data.
Historical benefit of trading monthly TAA strategies on the last day of the month:
In the graph below we look at how the day of the month an investor chose to execute trades would have affected the investor’s annualized return (compared to the average day). This data covers 55 TAA strategies as far back as 1970. Note: We normalize all months to have exactly 21 trading days (read more). Day 1 will always be the first day of the month, and day 21 will always be the last.
Trading on the last day of the month has resulted in a 0.57% annual boost to performance versus trading on the average day. That small difference is huge when compounded over time. A dollar compounded at 10% annually for 50 years becomes $117. When compounded at 10.57%, it becomes $152 (a 29% increase). In investing, the little things matter.
This observation has been consistent over time. In the graph below, we assume that an investor captured just that yearly performance boost from investing on the last day of the month. Note the consistent outperformance.
The special case of 2020:
As shown in the graph above, 2020 saw the biggest performance boost (+5.4%) from trading at month-end of any year since 1970.
That was a result of the pandemic pullback from late Feb to late Mar, which was historic in terms of how quickly it came on and subsequently reversed. Strategies that were traded around the third week of the month tended to be too bullish entering the downturn and too bearish on the recovery, while the same strategies traded around the turn of the month played the pullback much better.
We shouldn’t put too much significance on that single data point. Yes, it follows the historical tendency for month-end trading to outperform. But in an alternate universe, had things played out differently by just a week or two, the results could have been very different. We should consider treating the first quarter of 2020 as an outlier.
If we ignore Q1 2020, there was near zero impact from trading at month-end in 2020.
The case for a true advantage to trading at month-end:
There has been a consistent intramonth “seasonality” in many major asset classes related to the turn of the month. We’re not breaking new ground here; these types of seasonal anomalies have been well-known for a long time.
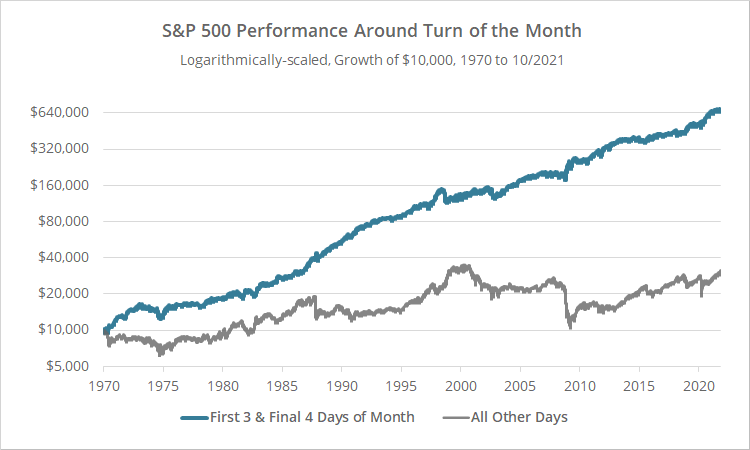
For example, in the following graph we show the result of holding the S&P 500 in the final 4 and first 3 days of each month (blue) versus all other days (grey) since 1970. Trading frictions have been ignored. Despite only being in the market about a third of the time, these “turn of the month” days captured the vast majority of returns.

Click for linearly-scaled chart, or an alternative analysis for the ETF SPY since 01/1993.
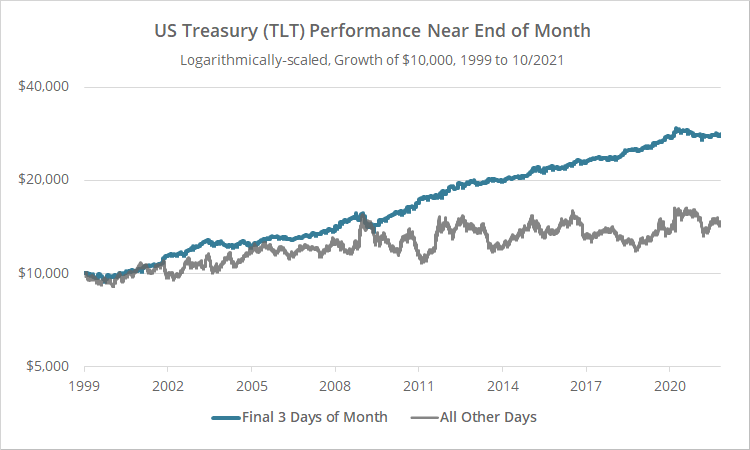
Here’s a similar graph for US Treasuries (TLT) in the final 3 days of the month (blue) versus all other days (grey) since 1999. Here we’re only in the market on 14% of days while capturing the meat of treasury returns. For a more in depth look at this particular seasonality, see this deeper dive.

Logarithmically-scaled. Click for linearly-scaled chart.
The point of showing these results is to demonstrate that there’s something unique about the turn of the month at a basic level. These seasonalities are not strong enough to be traded in isolation, but they certainly might be strong enough to bias the performance of a monthly tactical strategy.
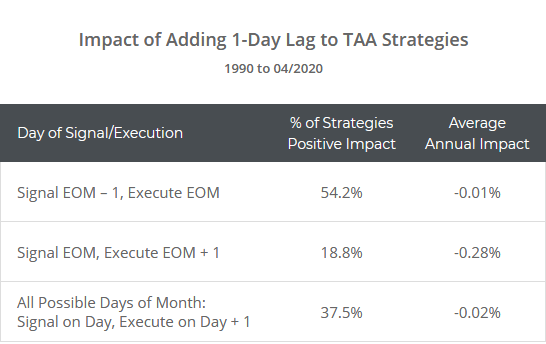
We’ve seen this turn of the month strangeness in other studies we’ve done. For example, the table below is taken from this study looking at the impact of adding a full 1-day lag to the 50+ monthly strategies that we track (i.e. executing trades at the next day’s close).
Generally speaking, adding a full 1-day lag had little impact on performance, except in the single case of signaling at end-of-month, but executing the next day. In that one instance, there was a significant negative impact on performance. Again, this is just another clue that there’s something unique happening around month-end.
In short, the case for there being a true advantage to trading at month-end is that we know there’s a lot of weirdness in the market near the end of the month. It’s not surprising then that there would be some impact to a monthly trading strategy that only executes trades during that period.
The case for NO advantage to trading at month-end:
The case for there being no advantage to trading at month-end is a logic argument.
Anytime we use historical data to create strategies that make predictions about the future, we should always be wary of whether we’ve overfit to that historical data – that we’ve confused useless noise in the past for a useful observation about the future.
One way to suss out whether we’ve overfit to the past is to make insignificant changes to our historical data and then analyze how the strategy would have responded. If the strategy is robust, those negligible changes should have little impact on historical results.
For example, on this site, we conform all asset classes to a common set of representative ETFs (read more). Why? Because, for long-term strategies like TAA, the difference between say SPY and IVV should be insignificant. If a TAA strategy soars on one, but falls down on the other, it’s almost certainly a sign of overfitting.
The fear here is that the outperformance when trading at month-end is a byproduct of overfitting; that because these strategies were designed using monthly data, any deviation from that negatively impacts backtested performance because it cancels out the “benefit” of that overfitting. Of course, that “benefit” is an illusion, as it’s unlikely to be replicated in the future.
If executing these strategies on days other than month-end didn’t matter, we would expect future, out of sample performance across trading days to be similar (given a large enough sample).
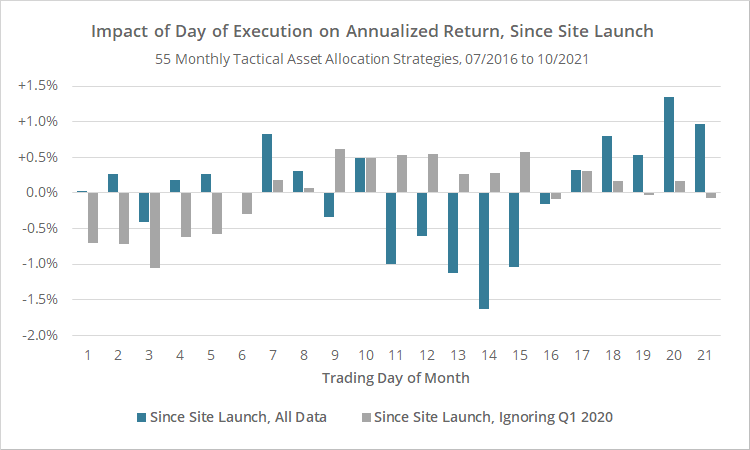
At first glance that appears not to be the case. Since launching this site in late 2016, trading at month-end has continued to outperform by more than 0.96% per year (even more than we saw in the longer sample). Most of that data is out of sample.
But if (and this is a big “if”) we ignore the pandemic pullback in Q1 2020, trading at month-end has actually slightly underperformed since our site launched. In the graph below we look at how the day of the month an investor chose to execute trades would have affected the investor’s annualized return since site launch, both including (blue) and excluding (grey) the first quarter of 2020.
How trading on a given day of the month handled Q1 2020 was obviously a defining moment for recent performance. And as discussed earlier, we should consider whether to treat Q1 2020 as an outlier. If we do, then there has been no recent advantage to trading monthly TAA strategies at month-end versus other days.
Of course, five years is relatively little data to consider for long-term strategies like these, so take this observation with a larger-than-usual grain of salt.
If one was to conclude that the outperformance when trading at month-end was totally a byproduct of overfitting (which we’re not), it would not mean these strategies were bunk, only that backtested results were a little too optimistic, and we should temper our expectations about the future.
A good back of the envelope estimate would be a haircut of 0.57% to the historical annualized return of each strategy. That’s based on comparing performance when trading at month-end versus trading on the average day of the month. It assumes the performance on the average day of the month is a better measure of the true historical performance of the strategy.
Our take:
There really is no wrong answer here; there are just varying degrees of diversification.
A lot of investors want the simplicity of trading just once per month. The freedom that TAA provides by producing strong performance while not requiring the investor to sit in front of a monitor all day is one of its greatest strengths as a trading style.
If an investor wanted to limit trading to just once per month, then there’s no reason to think that any day is better than the last day of the month. That’s how most of these strategies were originally designed, that’s how they’ve performed the best historically, and there’s evidence to support there being something special about market action near the turn of the month.
But if the investor is willing to up the hassle factor just a bit and spread changes to the portfolio across multiple days of the month, they buy themselves some insurance just in case trading at month-end significantly underperforms other days in the future. It’s simply another form of diversification (it’s the “When” of the What, When and How of diversification).
Practically speaking, how would an investor do that?
Let’s say you decided to combine 3 strategies in your custom Model Portfolio. One option is to select a different day of the month for each of those 3 strategies (resulting in 3 entries in your MP). A second option is to select 2 or more trading days and then trade all 3 strategies on each of those days (resulting in 6 or more entries in your MP).
Either way, total portfolio turnover (i.e. the dollar value bought and sold) would be roughly the same as going all in on one trading day. We’re simply spreading the changes out throughout the month.
Again, there’s no wrong answer here. The simple act of combining TAA strategies together is most of the battle. Spreading execution across multiple days of the month is just increasing the degree of diversification. Investors must decide whether the marginal benefit of that is something that they’re willing to work for.
New here?
We invite you to become a member for about a $1 a day, or take our platform for a test drive with a free membership. Put the industry’s best tactical asset allocation strategies to the test, combine them into your own custom portfolio, and follow them in real-time. Learn more about what we do.
* * *
Calculation note: We wanted to focus on reasonably active strategies, so throughout this post we’ve ignored any strategy with annual portfolio turnover < 50%. That left us with 55 strategies to consider.


