This is a test of the “Excess Earnings Yield Dynamic” valuation strategy based on the paper Man Doth Not Invest by Earnings Yield Alone by White and Haghani of Elm Wealth.
The strategy dynamically splits the portfolio between stocks and TIPS based on “excess earnings yield”, which is the cyclically-adjusted earnings yield (1 / CAPE) minus the real yield on 10-year TIPS. We have tested two variations of the strategy: valuation-only and with momentum.
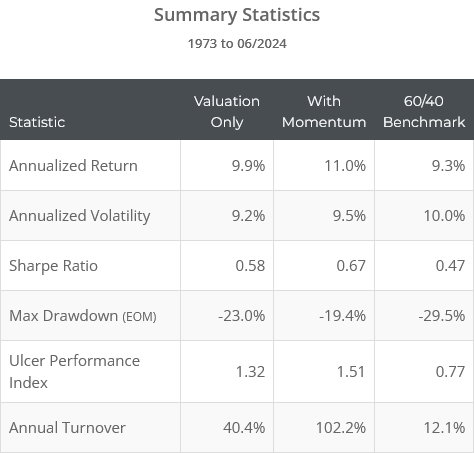
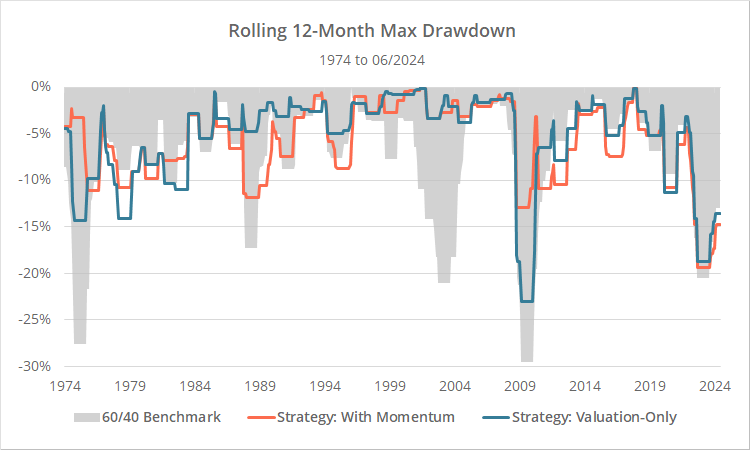
Strategy results from 1973 follow. Results are net of transaction costs – see backtest assumptions. Learn about what we do and follow 80+ asset allocation strategies like this one in near real-time.
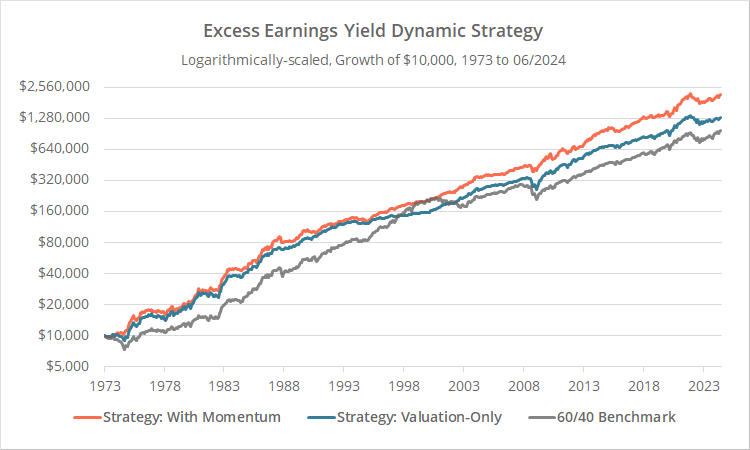
Logarithmically-scaled. Click for linearly-scaled results.
We track a handful of valuation models like this one (others include Countercyclical Trend Following and Risk Premium Value). Valuation models inherently tend to be contrarian, meaning an asset’s price going up makes it less appealing in the future, and vice versa.
That provides a nice counterbalance to pure momentum and trend-following strategies which work the opposite way: an asset’s price going up makes it more appealing. Combining dissimilar strategies like this (into what we call Model Portfolios) can help smooth out future returns.
Strategy rules tested:
On the final trading day of each month, we first find two key values:
-
Cyclically-Adjusted Earnings Yield:We start with the most recently available CAPE ratio (cyclically adjusted price-to-earnings ratio). CAPE is a popular stock market valuation metric. It can be calculated manually or is generously provided by Professor Shiller.The earnings yield is simply 1 / CAPE. It provides an estimate of long-term future stock market returns after inflation (1).Calculation note: We assumed an investor used the most recent quarter ending CAPE value from at least 3 months prior. This 3+ month lag is our own addition to the backtest to prevent lookahead bias; however, it actually improved historical results (a win-win).
-
The real yield on 10-year Treasury inflation protected securities (TIPS):This is the yield on TIPS, excluding the return tied to inflation.
We now have two competing measures of real (inflation-adjusted) return: one for stocks and the other for TIPS. We use them to determine the relative attractiveness of stocks vs TIPS (represented by the ETFs: SPY and TIP) as follows:
- Calculate the excess earnings yield by subtracting the real TIPS yield from the earnings yield.
-
For the variation of the strategy that includes momentum, determine the most recent 12 dividend-adjusted month-end closing prices for stocks, discounted for both inflation and a constant 4% annual risk premium.If the most recent value of that discounted series is greater than the average value of the series, add 2% to the excess earnings yield, otherwise subtract 2%.
-
Calculate the allocation to stocks using the Merton Rule as follows (2):Excess Earnings Yield / (2 * 0.182)The minimum/maximum allocation to stocks is 0%/100% (no shorting and no leverage).
- The portion of the portfolio not allocated to stocks is allocated to TIPS.
- Execute all positions at the close. Hold all positions until the last trading day of the following month. Rebalance monthly, even if no change is signaled.
The good and the bad of valuation strategies:
We like the logical consistency and simplicity of this strategy: simply compare an estimate of the expected performance of stocks to the expected performance of TIPS and allocate appropriately.
The problem of course is that “long-term” is just that: long-term. Market valuations can stay irrational for years and decades before correcting. Further, pure valuation strategies are unable to react to short-term market movement, like sudden downturns, which can make them difficult to follow.
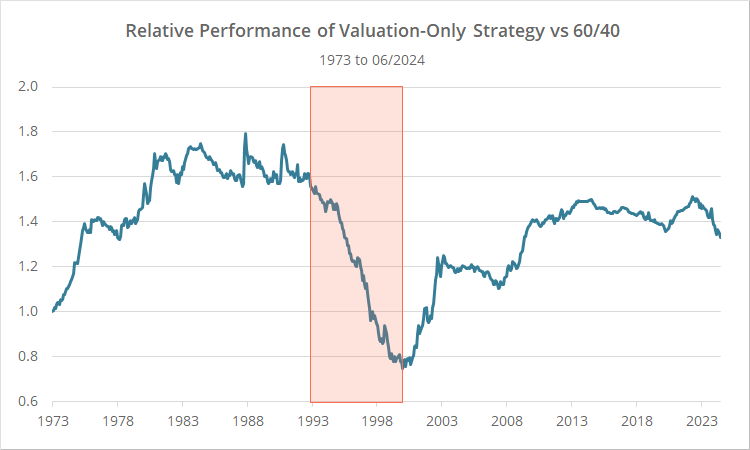
To illustrate, in the chart below we show the relative performance of the valuation-only strategy versus the 60/40 benchmark. When the line is rising, the strategy is outperforming, and vice-versa.
The strategy generally either matched or outperformed the benchmark over our test, except in the 1990’s (the red highlighted area) when it was abysmal.
That makes sense. Valuations during the 1990’s started a bit high and then climbed higher and higher before the internet bubble finally popped around the end of the decade (the same might eventually be said for our current market).
Throughout, this strategy would have been continually reducing exposure to stocks, hence the reason the strategy underperformed so badly during the 1990’s, and subsequently outperformed when the bubble burst. In the end, the assessment that the market was overvalued was correct, but it took a decade to prove that out.
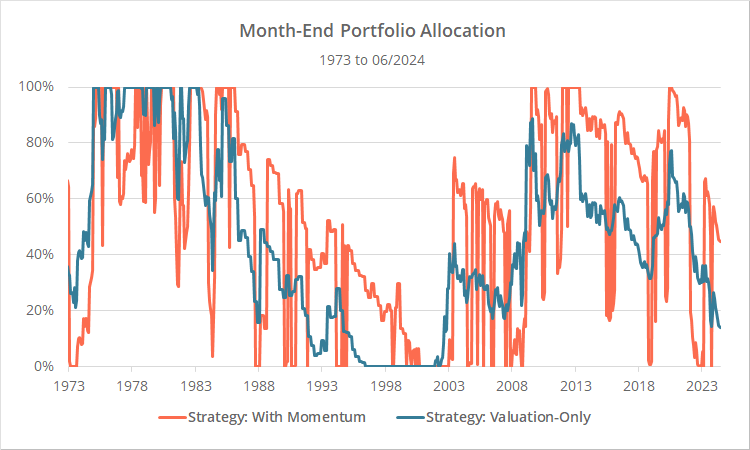
The variation of the strategy that includes momentum mitigates this to some degree, but market valuation still largely drives allocation. To illustrate, in the graph below we show month-end allocation to stocks for the valuation-only (blue) and momentum (orange) variations. Note how allocation rises and falls based on momentum, but still generally ebbs and flow with valuation.
An inherent shortcoming:
The strategy is measuring the relative attractiveness of stocks versus TIPS and will usually hold some mix of the two. That provides some diversification, especially against most stock market downturns.
What happens though when everything goes down like we saw in 2022? The strategy will inherently perform poorly because there is no safe third option like T-Bills.
We’ve written a lot about this subject over the years. We attempt to model each strategy’s exposure to this type of risk with our Exposure to Rising Interest Rates report. Strategies that do a good job managing this exposure did well in 2022. Those that do not (like this strategy) did poorly. Read more.
A note about data quality:
Our usual warning about strategies that rely heavily on TIPS applies here as well:
US TIPS index data does not exist prior to 1997. More than any other asset class we cover, historical TIPS simulations should be taken with an extra-large grain of salt. They are an educated guess.
That is doubly true with this strategy because we must not only simulate historical TIPS returns, but also historical real TIPS yields.
Do we think our replication is accurate in general terms? Yes. But in terms of any particular month or even year, actual results had TIPS existed could have been very different.
Our take on the Excess Earnings Yield Dynamic Strategy:
As mentioned, as a concept we like the logical consistency and simplicity of the strategy. There are inherent downsides to all valuation strategies because markets can stay over/undervalued for years and decades. And there is an inherent shortcoming in this particular strategy because there is no safe third option when both stocks and TIPS fall.
We are strong proponents of combining strategies together into what we call Model Portfolios (we couldn’t imagine going 100% all in on a single strategy). Combining dissimilar strategies helps to smooth returns and makes it easier for investors to stay the course during tough times.
A valuation strategy like this one can provide a useful counterbalance to other types of strategies like trend-following, momentum, economic growth, etc.
If we were trading just a single strategy we would likely choose the variation with momentum, but assuming the strategy was just one component of a Model Portfolio, the valuation-only variation might be more useful (because so many tactical strategies already have exposure to momentum).
Just be aware that while over the very long-term we expect the Excess Earnings Yield Dynamic Strategy to get the relative valuation of stocks vs TIPS correct, in the shorter-term (which might be measured in multiple years) it could be on the wrong side of the market.
Outro:
A big thank you to Haghani and White of Elm Wealth. They were very helpful in working with us to clarify some of the rules from their paper. As long-time readers know, we are always appreciative of authors who are so transparent and willing to expose their results to sunlight.
Haghani and White have written a number of other papers that we encourage readers to check out.
New here?
We invite you to become a member for about a $1 a day, or take our platform for a test drive with a free membership. Put the industry’s best Tactical Asset Allocation strategies to the test, combine them into your own custom portfolio, and follow them in real-time. Learn more about what we do.
* * *
Calculation notes:
(1) See the authors’ paper and Asness’ classic Market Timing: Sin a Little for a discussion of why CAPE and earnings yield alone are good at explaining past returns but have done a poor job timing future returns.
(2) The value 0.18 represents the annual volatility of stocks. The use of a constant 0.18 was an optional rule provided by the authors. The value can be determined dynamically, but the process is cumbersome and we found almost no difference in these results when doing so. We’ve opted to keep things simple and just use the constant 0.18 value.
