Markets have started the month weak. We got spoiled last year. After such an abnormally long period of market calm, it’s natural for investors to feel a little anxious.
We have no opinion on where the markets go from here. That’s why we’re quantitative traders. We put a lot of time into understanding these models so that we have signposts to follow during periods of market turmoil. What we can talk about however is how tactical asset allocation strategies have responded to past market crises, and more specifically, how long it took them to de-risk, so that we know what to expect should this bearishness continue.
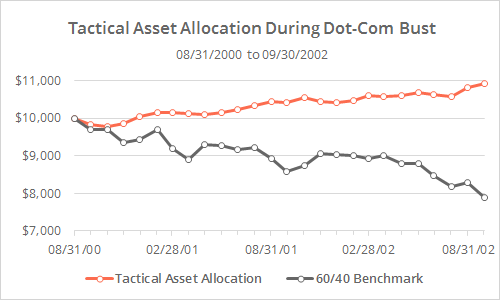
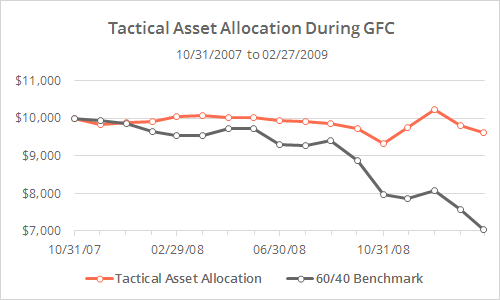
With such a large pool of published strategies to draw on (41 and counting), we’re able to draw some broad conclusions about TAA investing as a whole. In this post we’ll look at how quickly TAA adjusted to the two most significant bear markets in recent history. But first, let’s look at the end goal. Below we’ve shown the average return of all 41 TAA models that we track (orange) versus the 60/40 benchmark, during the Dot-Com Bust of 2000-02 and the Global Financial Crisis of 2007-09. Click to zoom.
During the Dot-Com Bust, the 60/40 benchmark lost -21% while TAA gained 9%, and during the Global Financial Crisis, the benchmark lost -29% while TAA pared that down to just a -4% loss.
Why did tactical asset allocation outperform?
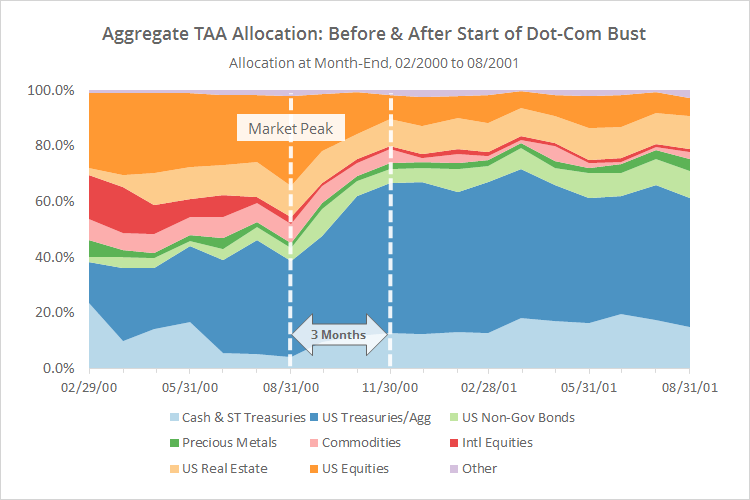
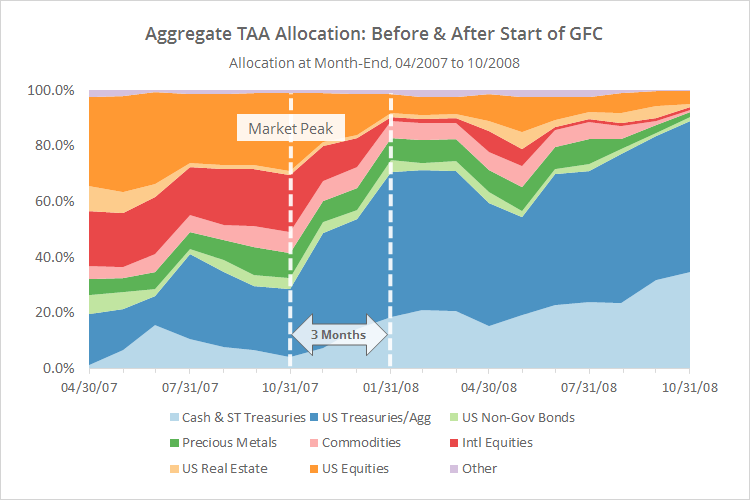
In the next two graphs we show the aggregate asset allocation of all of the strategies that we track in the 6-months before each market peak, and the 12-months after. Assets have been grouped into broad categories. For example, “US Equities” may include everything from the S&P 500 to individual stock market sectors. Defensive assets tend to be towards the bottom of the chart, and offensive towards the top.
Two key observations:
- At the start of each crisis, TAA was postured offensively, with high exposure to risk assets like equities, and low exposure to defensive assets like cash and treasuries. The same holds true today. TAA is currently (on average) about 60% allocated to risk assets (see our most recent TAA monthly performance report for a data dump).
- During both previous crises, it took about 3-months for TAA to de-risk. Some delay is necessary. Too much delay and the portfolio is too slow to respond. Too little delay and TAA would be more prone to whipsaws as we saw in 2015-16. That means TAA investors should be prepared for a period of adjustment if this is a new regime.
This is all complicated by the fact that during previous crises, TAA made heavy use of US Treasuries as a defensive asset. That of course is a concern given UST’s lack of running room. Our expectation is that during the next crisis TAA would make greater use of cash. A number of the strategies that we track are built to rotate into shorter duration instruments like cash when longer duration Treasuries are weak (ex. Generalized Protective Momentum and PAA-CPR). Learn more.
None of this is an indication that we expect the market to weaken from here. The market could bounce, plummet, or yawn next week. We have no opinion on the matter. We leave the crystal balls to the pundits. What we can do is model what TAA investors might expect in the coming months in terms of the speed at which TAA could de-risk should the markets continue to sour. Of course, every crisis is different (and the past merely rhymes), so treat these results as broad observations.
We invite you to become a member for about a $1 a day, or take our platform for a test drive with a free limited membership. Put the industry’s best tactical asset allocation strategies to the test, combine them into your own custom portfolio, and then track them in near real-time. Have questions? Learn more about what we do, check out our FAQs or contact us.


