This is a test of two tactical asset allocation strategies from Brian Livingston’s new book Muscular Portfolios and his site MuscularPortfolios.com: the “Mama Bear” and “Papa Bear” Portfolios.
The short and sweet take: neither of these strategies tread new ground – they’re both based on the tried and true concept of “relative” (aka cross-sectional) momentum, and both are very similar to other strategies that we’ve tested here. The strength of Livingston’s book is the clear and concise way he walks less sophisticated investors through the need for a tactical solution, and we highly recommend it for investors who are new to tactical asset allocation.
Results net of transaction costs follow. Read more about our backtests.
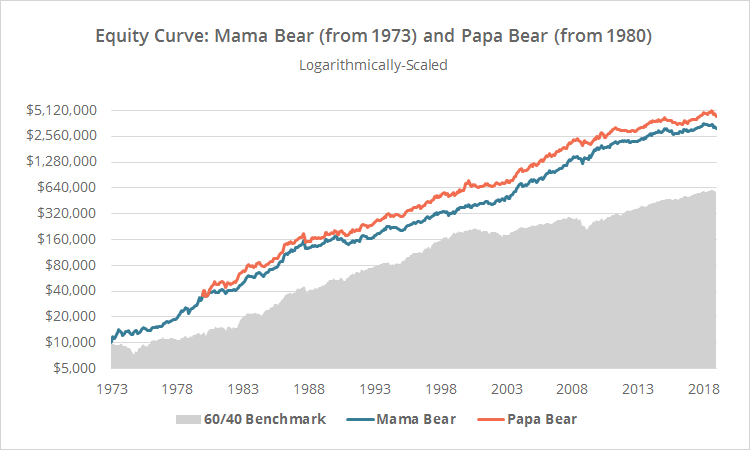
 Logarithmically-scaled. Click for linearly-scaled chart.
For simplicity’s sake, we’ve combined our backtests of the Mama Bear (blue) and Papa Bear (orange) strategies into one chart. The Papa Bear test is shorter and (for the chart above only) simply starts at Mama Bear’s current portfolio size on that date.
Note that our test is shorter than the author’s. That’s not uncommon. We’re much stricter than most about the quality of historical data we use to simulate historical asset class performance.
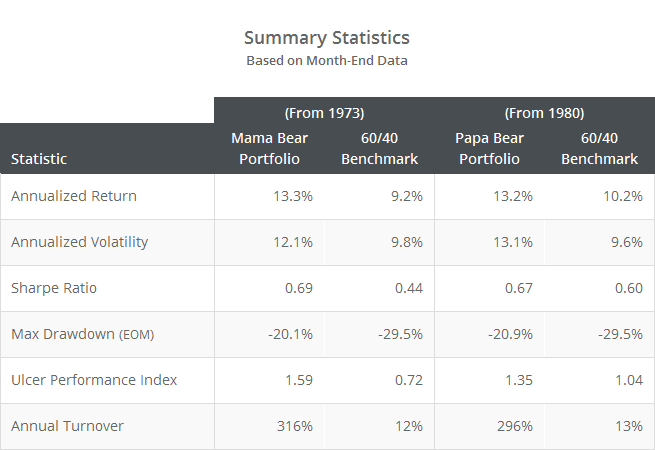
Both strategies have been quite volatile relative to others that you’ll find here, with Papa Bear exhibiting the second highest portfolio vol out of the 40+ models that we track (behind only the recently added Accelerating Dual Momentum). That’s probably in part due to a lack of a strong “absolute” momentum component to turn the strategy off during periods of market stress.
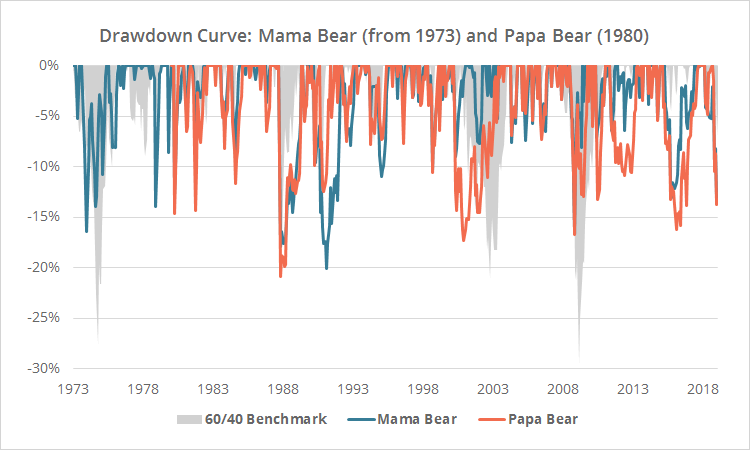
Despite that, both strategies have been a solid improvement over buy and hold in terms of returns relative to both volatility (Sharpe) and drawdowns (UPI).
About the Muscular Portfolios Strategies
Both strategies trade once per month, using “relative” (aka cross-sectional) momentum. In other words, they measure the momentum of a basket of asset classes, and choose those with the highest momentum scores, regardless of whether those scores are positive or negative.
Both select the 3 assets with the highest momentum score, and hold them until the following month. Where the strategies differ is in the asset universes traded, and the way in which they measure momentum:
- Mama Bear trades a basket of 9 asset classes (see end notes for a complete list). Papa Bear expands this to 13 asset classes, and divides US equity exposure between growth and value.
- Mama Bear measures momentum based on each asset’s 5-month return. Papa Bear measures momentum based on the average of each asset’s 3, 6 and 12-month returns.
Livingston includes a near real-time widget for both strategies on his site to help DIYers follow his models [Mama Bear | Papa Bear]. We’ve deviated slightly from Livingston’s website implementation to fit the standardized approach we take on our site, but the meat of the strategy is the same. See end notes for details.
Shoulders of Giants
Both of Livingston’s strategies are near clones of other strategies from some very smart folks:
- Mama Bear: CXO Advisory’s SACEMS strategy (read CXO’s take on the book)
- Papa Bear: Meb Faber’s GTAA – Agg. 3 (although importantly, it lacks the “absolute” momentum feature of Faber’s model).
That’s by design. I think that (like our own site) Livingston recognizes that much of the brain work of designing these strategies has already taken place. His role is to make these strategies available to the broader investing community.
One Small Point of Disagreement
One small point of disagreement with Livingston’s results. This is a monthly trading strategy, and the results above assume that an investor traded at the close on the last trading day of each month. Livingston states that the day of the month that you choose to trade doesn’t really matter, as long as it’s consistent.
But as we’ve shown in the past, monthly TAA strategies consistently tend to outperform when trading near the “turn of the month”, meaning near the beginning or end of the month (read more). Based on how we measure such things, that has definitely been the case with the Mama Bear portfolio.
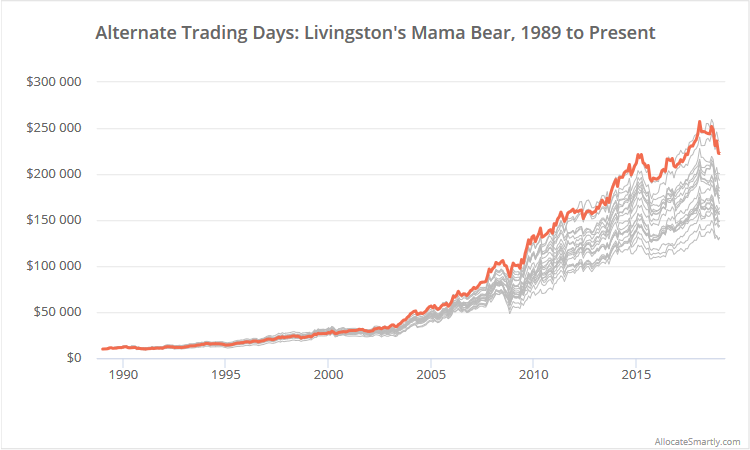
To illustrate, below we’ve shown the result of trading the Mama Bear portfolio on other alternate trading days. Month-end trading is highlighted in orange. All other days are shown in grey. There has been a wide disparity in results, depending on the day of the month an investor chose to trade.
 Linearly-scaled. Click for logarithmically-scaled chart.
We measure performance on alternate trading days using a unique method to maintain the integrity of monthly indicators (like a “10-month moving average” for example), but whatever method you opted to use would probably show similar results.
We’re not saying that all investors should trade Livingston’s strategies at month-end. What we are saying is that historical results have varied widely depending on the trading day, so it’s not a “whatevs” decision. Of course, you can control that trading day risk with portfolio tranching.
In Summary
As previously noted, neither of these strategies tread new ground. Both are based on the tried and true concept of “relative” (aka cross-sectional) momentum, and both are near clones of other well-known strategies.
The strength of Livingston’s book Muscular Portfolios is the clear and concise way he walks less sophisticated investors through the need for a tactical solution like the Mama Bear and Papa Bear portfolios. We agree with that message, and we recommend his book for investors who are new to TAA.
New here?
We invite you to become a member for about a $1 a day, or take our platform for a test drive with a free limited membership. Put the industry’s best tactical asset allocation strategies to the test, combine them into your own custom portfolio, and then track them in near real-time. Have questions? Learn more about what we do, check out our FAQs or contact us.
End Notes:
A list of assets traded by each strategy:
- Mama Bear: DBC, EEM, EFA, GLD, IWM, SHV/cash (see below), SPY, TLT, VNQ
- Papa Bear: BNDX, DBC, EEM, EFA, GLD, IEF, IWD, IWF, IWN, IWO, LQD, TLT, VNQ
A list of differences between our test and Livingston’s book/website follow (beyond basic backtest assumptions):
- We use slightly different ETFs to represent some asset classes (quite intentionally, read more). Additionally, we’re much stricter than most about the quality of historical data we use to simulate historical asset class performance (read more). Generally-speaking, the latter is the biggest source of differences between our test and authors.
- We use months to calculate momentum scores rather than days. For example, Mama Bear uses a 5-month lookback, whereas Livingston’s website uses 105-days. Based on the fact that Livingston conducted the backtests for his book using Meb Faber’s Idea Farm workbook, we know that Livingston’s book results are based on months (not days) as well, so we’re in the clear here. Just be aware, there may be a small discrepancy between our current results and his website.
- Livingston states that there isn’t a need to rebalance the portfolio unless the asset is more than 20% off its target dollar amount. Our results assume that the portfolio was rebalanced monthly, regardless of whether there was a change in position. We suspect based on his use of Faber’s Idea Farm workbook, that his book results match our assumptions.
- In the case of the Mama Bear portfolio, as we do throughout this site, trades in short-term US Treasuries (SHV) are assumed to instead be placed in cash. US interest rates are too low at this moment in history, considering transaction costs and how frequently this strategy trades, to justify trading SHV. Practically-speaking, this change had little impact on long-term returns.
- In the case of the Papa Bear portfolio, our results do not include intl. aggregate bond exposure (BNDX) prior to 1988 due to a lack of accurate asset data. Prior to this date, we’ve replaced BNDX with intl. Treasuries (BWX). Based on the fact that Livingston conducted the backtest for his book using Faber’s Idea Farm workbook, we assume that he did something similar.


