Long-term returns for US Treasury bond funds with a constant maturity (like IEF, TLT and SHY) have been quite predictable simply using initial Treasury yields as an estimate. This observation was popularized by John Bogle. Here’s an excellent recent look from Portfolio Optimizer.
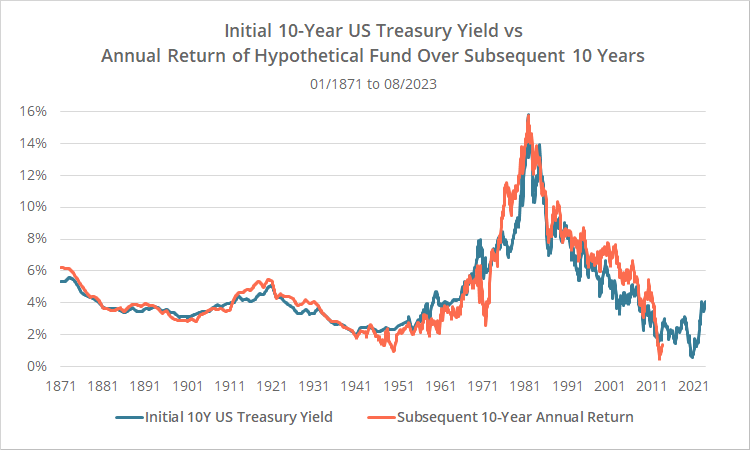
How predictable? Below we’ve shown the intial yield on 10-Year US Treasury notes since 1871 in blue, versus the annual return over the subsequent 10 years on a hypothetical constant maturity bond fund in orange. An ETF like IEF will match the orange line very closely.
Note: The orange line doesn’t extend to the present day, because that 10-year period of future returns hasn’t happened yet.
From this 30,000 foot view, initial yields and subsequent 10-year returns have clearly ebbed and flowed together.
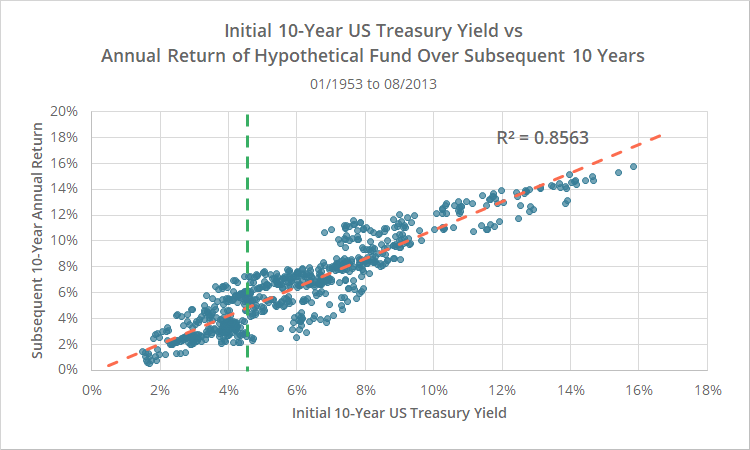
Next, we show a scatterplot of initial 10Y yields (x-axis) versus annual returns over the subsequent 10-years (y-axis). Note the high R2. Intitial yield has explained ~86% of subsequent 10-year returns.
The green line roughly shows the most recent 10-year US Treasury yield (4.735%).
Geek note: Why does the scatterplot only cover from 1953 onwards? Our yield data prior to 1953 is sourced from Dr. Shiller’s dataset and is monthly data linearly interpolated from annual data. Excluding that pre-1953 data lowered the R2 but made for a more precise analysis.
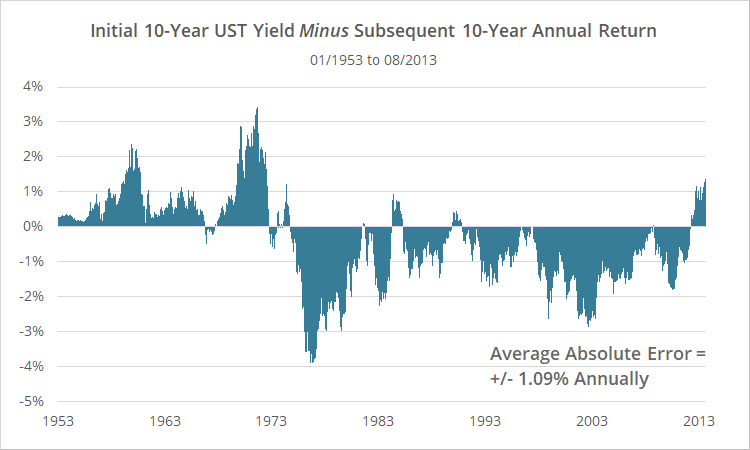
How badly has the estimate missed? Generally, not by much, but occasionally by a country mile. Below we show the difference between our initial estimate and subsequent 10-year returns. Positive values mean our estimate was too high, and negative values mean our estimate was too low.
The average absolute error was just +/- 1.09% (10-year, annualized) but ranged from -3.9% to +3.4%. The accuracy of the estimate will depend on how much rates change over the subsequent 10-years (as well as how high or low the initial yield is…more on this in a moment).
Note how our estimate was too high over the first 20-years in our sample as yields progressively rose (acting as a drag on future returns), but too low in the next 40+ years as yields consistently declined (acting as a tailwind on future returns).
Other durations:
We focused on 10-year US Treasury yields up to this point, because they’re smack dab in the middle of the yield curve, and intermediate-term bond funds like IEF are popular with investors. What about other longer or shorter durations?
Shorter durations are even more predictable, but over a shorter future time horizon. For example, 3-year US Treasury yields would be most predictive of returns for an investment like SHY over the next 3 (not 10) years. Longer durations are less predictable, but over a longer future time horizon.
That discussion is beyond the scope of this post, but interested readers can refer to Portfolio Optimizer for more data.
What do we do with this knowledge?
That depends on whether you’re a tactical or a buy & hold investor.
For Tactical Asset Allocation (TAA) investors:
Unfortunately, as we showed with stock market valuation models, there’s not a lot of short-term value in these kinds of long-term estimates. Even if we knew with perfect foresight total treasury returns over the next decade, there would be a lot of zigs and zags along the way and these long-term predictions are not going to do anything to help you navigate them.
However, there is one way in which the current state of bond yields do matter to TAA investors.
As we showed in this analysis, an extended period of rising rates is much more detrimental to treasury returns when rates start from a low base because the coupon is too small to overcome the impact of rising rates. That’s why bonds didn’t see nearly as much impact from rising rates in say the 1970’s as they did last year when rates were rising from a historically low base.
That means that the higher rates rise from here, the less potential short-term downside there is for US Treasuries, and the less important it is to select strategies that aggressively manage that exposure. A small comfort perhaps?
For buy & hold investors:
Of course, for buy & hold investors all of this matters tremendously.
Coupled with our aggregate stock market valuation, we can predict with some confidence returns for stocks and bonds over the next decade. Nearly all signs point to it being a lukewarm time for balanced portfolios.
Our projection for the 60/40 over the next 10 years is just 4.1% annually as of today. That’s far below historical averages in the 8-9% range.
New here?
We invite you to become a member for about a $1 a day, or take our platform for a test drive with a free membership. Put the industry’s best Tactical Asset Allocation strategies to the test, combine them into your own custom portfolio, and follow them in real-time. Learn more about what we do.


