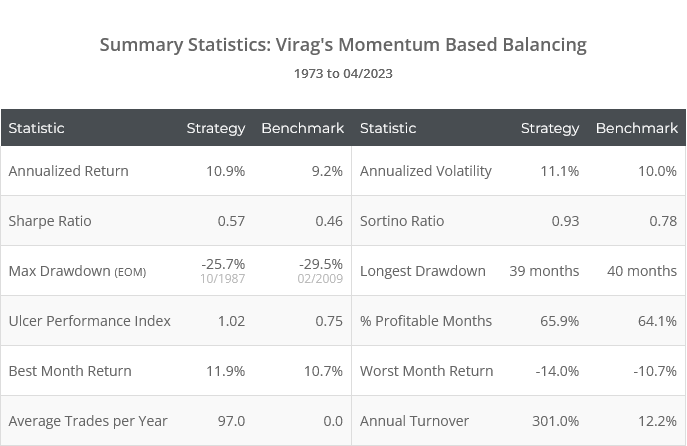
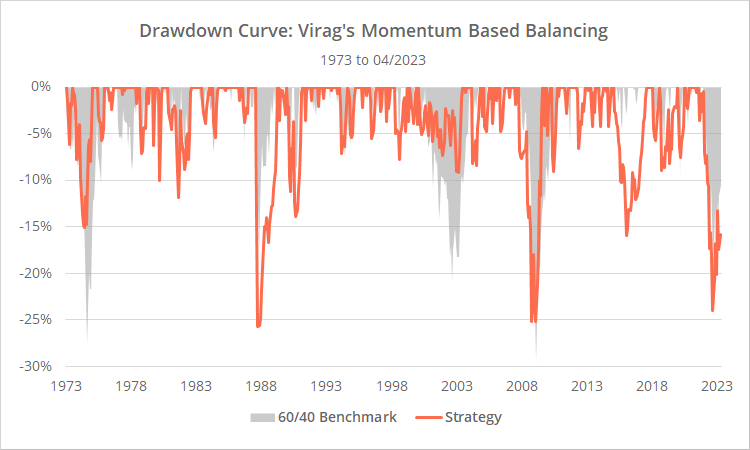
This a test of Mark Virag’s paper “Momentum Based Balancing for the Diversified Portfolio” (NAAIM Wagner Award winner, 2014). This is a relative momentum strategy that provides an interesting contrast to a popular strategy we track: FinancialMentor.com’s Optimum 3. More on this later.
Backtested results from 1973 follow. Results are net of transaction costs – see backtest assumptions. Learn about what we do and follow 70+ asset allocation strategies like this one in near real-time.
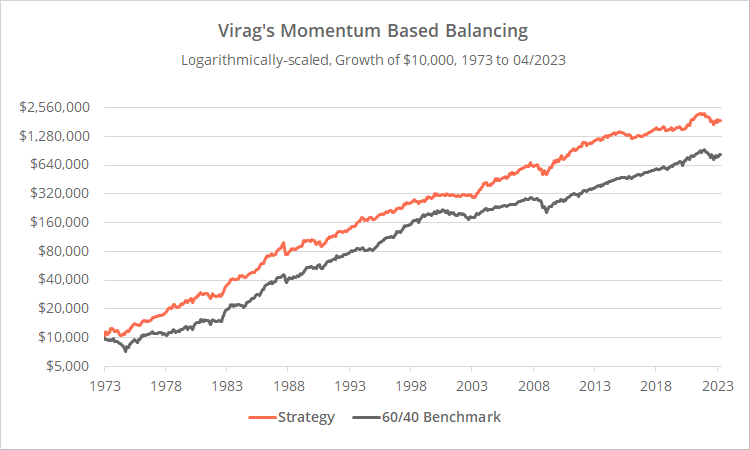
Logarithmically-scaled. Click for linearly-scaled chart.
The core premise of this strategy is that the rank of recent returns can predict future returns. Given 10 assets, the asset with the highest recent returns will tend to have higher future returns than the #2 asset. #2 will be better than #3, #3 better than #4, and so on.
The strategy takes what’s referred to as “relative momentum” to the extreme. Not only are we using the rank of recent returns to determine which assets to buy, but we’re also allocating more to those assets that rank higher.
Strategy rules tested:
The strategy rules are simple:
-
At the close on the last trading day of the month, calculate the 3-month return of the following 10 assets:US large caps (represented by SPY), US small caps (IWM), materials sector stocks (XLB) (*), developed intl. equities (EFA), emerging market equities (EEM), US real estate (VNQ), int-term US Treasuries (IEF), long-term US Treasuries (TLT), US TIPS (TIP) and “cash”.
Cash is always assumed to have a 3-month return of zero. Below are sample 3-month returns that we’ll use to explain the rest of the strategy:
SPY IWM XLB EFA EEM VNQ IEF TLT TIP Cash -1.7% 1.0% -2.6% 0.1% 0.6% 5.4% 1.0% 1.0% 1.7% 0.0% -
Determine the second lowest return (-1.7%). This is our baseline value.
Subtract the baseline value from all 3-month returns. The baseline value is usually a negative number, in which case we’re increasing each 3-month return, i.e. subtracting a negative. Set any 3-month return less than our baseline value to zero.
SPY IWM XLB EFA EEM VNQ IEF TLT TIP Cash 0.0% 2.7% 0.0% 1.8% 2.3% 7.1% 2.7% 2.7% 3.4% 1.7% - Add all of our adjusted 3 month returns together (sample total = 24.4%)
- Divide each asset’s adjusted 3 month return by the total. This is the % allocated to each asset at the close.
SPY IWM XLB EFA EEM VNQ IEF TLT TIP Cash 0.0% 11.1% 0.0% 7.4% 9.4% 29.1% 11.1% 11.1% 13.9% 7.0% - All positions are executed at the close. Hold all positions until the last trading day of the following month.
“Relative momentum” taken to the extreme:
We track a lot of strategies that make use of “relative momentum”, i.e. buying (selling) assets exhibiting stronger (weaker) momentum than other assets in the universe. A classic example is Meb Faber’s “GTAA Aggressive” (member link | public link).
While those strategies may use relative momentum when selecting assets, they use some other approach when weighting assets, i.e. determining how much to allocate to each asset.
This strategy takes relative momentum to the extreme by using very recent performance to both select and weight assets. Using relative momentum in this way implicitly makes a big assumption: that the very specific relative rank of assets matters a lot. The top momentum asset will tend to be better than the #2 asset, #2 better than #3, etc.
How well has that assumption held historically? Below we’ve taken the same 9 assets traded by Virag’s strategy (minus cash) and looked at the next month’s performance when that asset had the highest return over the previous 3 months (#1), the second highest (#2), etc.
| Next Month Asset Performance by Recent Return Rank 1973 to 04/2023 |
||
|---|---|---|
| 3-Month Return Rank |
Avg. Next Month Return |
Next Month Vol-Adj Return |
| 1 | 1.0% | 0.18 |
| 2 | 1.1% | 0.27 |
| 3 | 0.8% | 0.19 |
| 4 | 0.7% | 0.18 |
| 5 | 0.7% | 0.16 |
| 6 | 0.6% | 0.14 |
| 7 | 0.4% | 0.10 |
| 8 | 0.3% | 0.07 |
| 9 | 0.5% | 0.09 |
Simply looking at next month’s return is a little misleading because more volatile assets are more likely to be either the #1 or #9 ranked assets. To adjust for that we’ve also provided a “volatility-adjusted return” (calculated as geometric avg. return divided by the standard deviation of returns).
Below we’ve graphed the volatility-adjusted returns for each rank:
Yes, broadly speaking, assets exhibiting higher momentum have produced stronger next-month performance, but the observation hasn’t been very clean. Performance doesn’t fit the type of linear progression we would hope for if using it to determine both our asset selection and weighting.
Two additional drawbacks of using relative momentum in this way:
- Offensive assets like equities and real estate tend to move together, as do defensive assets like bonds. That means that the strategy will naturally tend to be highly concentrated in either offensive or defensive assets depending on which is in favor at the moment.
- Executing trades that are only marginally better (or in this case, perhaps not better at all), generates unnecessary transaction costs and slippage, and increases tax liability if trading in a taxable account (read more).
Contrasting with Financial Mentor’s Optimum 3:
This strategy provides a useful contrast with a popular strategy we track: Optimum 3 (member link | public link).
Optimum 3 also considers short-term relative momentum when selecting which assets to hold each month, but it takes a completely different approach when it comes to weighting those assets.
Rather than assuming asset #1 is better than asset #2 and so on, it assumes that the entire “top half” of assets is equally good. It then asks how it can make the most robust portfolio from those top half assets. It defines “robust” as the 3 assets with lowest average correlation to the remaining assets in the portfolio.
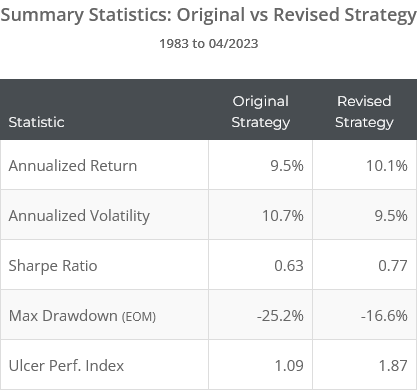
Below we’ve shown our original test in blue, versus the same strategy traded using something more like Optimum 3’s approach to allocation in orange. This is not the complete Opt3 strategy – there are other differences between the two – the key takeaway is that we’re not prioritizing assets simply because they rank higher.
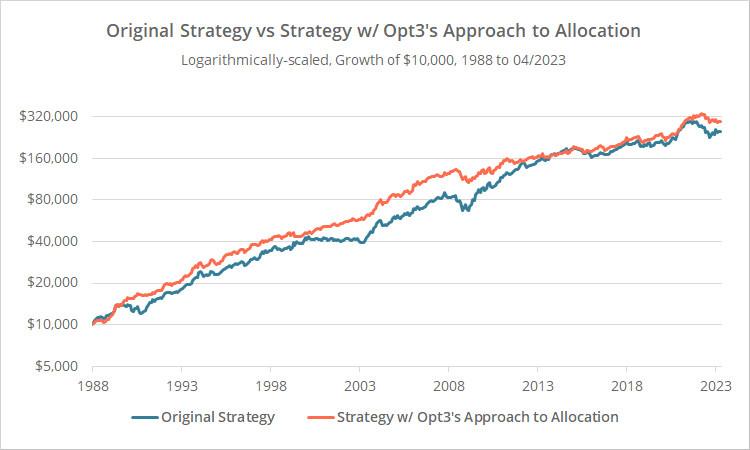
Logarithmically-scaled. Click for linearly-scaled results.
Visually, we see that the revised strategy (orange) has provided a smoother, more consistent ride, and that bears out in the risk-adjusted statistics (Sharpe and Ulcer Performance Index).
Because Virag’s original approach tends to hold concentrated risk on/risk off positions it will outperform during good times, but underperform during bad times. Opt3’s more balanced approach has smoothed out that variability without sacrificing long-term returns.
Smooth returns is key to keeping investors from making bad decisions during tough markets.
Our take:
As we’ve discussed before, we view momentum as a hammer, not a scalpel. Holding a basket of assets, all of which have positive momentum, preferably with some degree of diversification, is a good approach that has worked for essentially as long as financial markets have existed.
But putting too much importance on finding the absolute tippity-top momentum asset is probably overkill. Momentum is not a scalpel, and the top momentum asset probably isn’t much better than other assets exhibiting slightly less (but still positive) momentum.
New here?
We invite you to become a member for about a $1 a day, or take our platform for a test drive with a free membership. Put the industry’s best tactical asset allocation strategies to the test, combine them into your own custom portfolio, and follow them in real-time. Learn more about what we do.
* * *
(*) Our historical data for the “materials sector stocks” asset class (represented by XLB) only extends back to late 1989. Prior to that, we substituted diversified commodities (PDBC). We took this creative liberty based on the author’s discussion about not using DBC due to a lack of actual historical ETF data at the time the paper was written.
