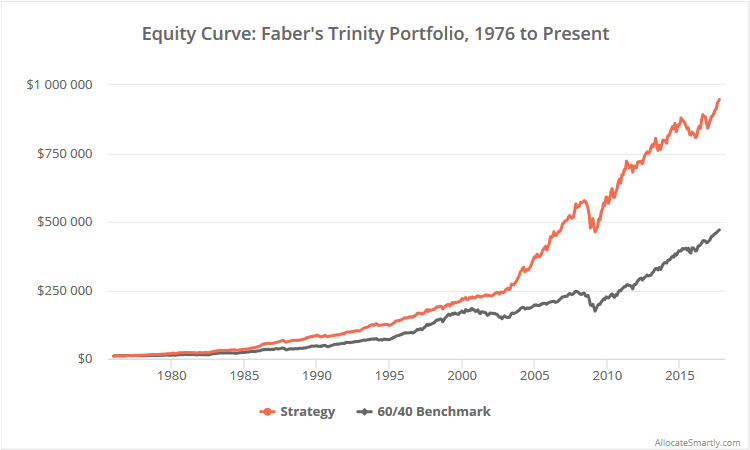
This is a test of the Trinity Portfolio from Meb Faber and Cambria Investments, so named for the three key elements of the strategy: (1) a globally diversified mix of assets, (2) a tilt towards the value and momentum factors, and (3) exposure to momentum and trend-following. We’ve titled our test Trinity “Lite” because we’ve made some not insignificant changes to Faber’s original model in order to fit the standardized approach we take on this site (trading via large, liquid ETFs). More on this in a moment.
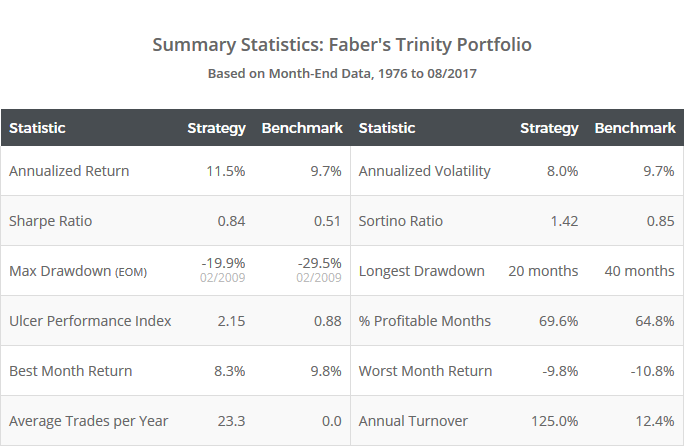
Results from 1976 to the present, net of transaction costs, follow. Read more about our backtests or let AllocateSmartly help you follow this strategy in near real-time.

Linearly-scaled. Click for logarithmically-scaled chart.
Meb Faber needs no introduction. He’s written a number of seminal papers and books that have contributed to the surge in interest in tactical asset allocation strategies over the last decade. Our members area currently includes six of Faber’s strategies.
Strategy rules tested:
The Trinity Portfolio is split into two equal halves. The first invests in a static buy & hold allocation, and the second in a dynamic momentum/trend-following strategy.
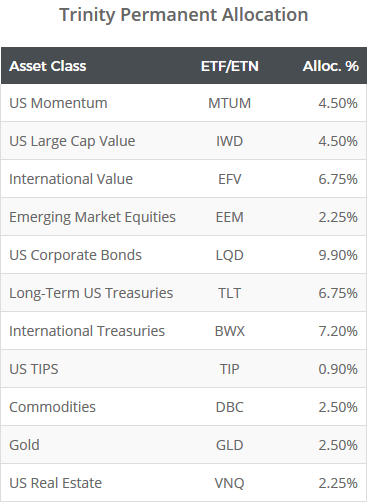
The buy & hold half of the portfolio is loosely based on the Global Market Portfolio (GMP). In theory, the GMP is meant to represent all financial assets held globally (i.e. the ultimate benchmark). In practice, the GMP is difficult to replicate with much granularity, so Trinity boils the GMP down to 10 representative asset classes (which we’ve expanded to 11…more on this in a moment).
The buy & hold half of the portfolio is allocated as follows:
The original Trinity strategy added momentum and value factor tilts to US equities, and a value tilt to international equities, via individual stocks. We’ve accomplished something similar here by representing US equities with MTUM (momentum) and IWD (value), and international equities with EFV (value).
The first two “legs” of our Trinity Portfolio are now in place: a globally diversified mix of assets with a tilt toward the momentum and value factors.
The second half of the Trinity Portfolio applies simple momentum and trend-following rules to this same set of asset classes. These are the same rules used by the “Aggressive” models in Faber’s very first paper: A Quantitative Approach to TAA:
- Momentum rule: At the close on the last trading day of each month, measure each asset’s momentum by averaging the asset’s 1, 3, 6 and 12-month total return. Select the five assets with the highest score (i.e. the top half).
- Trend-following rule: For each asset selected, if the asset will close above its 10-month moving average, allocate one-fifth of the remaining portfolio (10%) to that asset at the close, otherwise allocate that portion of the portfolio to cash.
- Calculation note: The Trinity white paper treated US equity exposure (via individual stocks) as a single entity for the purposes of the two rules above. We’ve instead represented US equity exposure using two ETFs (MTUM and IWD), but we’ve also treated them as a single entity. In other words, MTUM and IWD always act together. We don’t want to bog down the flow of this post, but readers interested in the simple math behind how we did this, please contact us.
The entire portfolio is assumed to be rebalanced monthly, but practically speaking, the buy & hold half of the portfolio could be rebalanced far less frequently with little impact on results.
What’s good about this strategy:
Like most of the TAA strategies that we track, the strength of the Trinity Portfolio has not simply been outperforming the market. It’s been outperforming the market while better managing volatility and reducing drawdowns. But it’s obvious that Faber designed Trinity based on what’s both quantitatively sound and logical, as opposed to simply what makes for the sexiest backtest.
For example, Faber uses the same core rules in this strategy as his first paper way back in 2007 (i.e. 1/3/6/12-month return, coupled with a 10-month moving average). Could Faber have “improved” the results shown here by tweaking those parameters? Absolutely. But Faber understands a fundamental truth about quantitative trading: it’s very hard to predict what specific set of parameters is going to outperform out of sample. Choosing parameters that have performed the absolute best in the past is the wrong approach. Choosing parameters that fall somewhere in the middle among strongly performing choices, as he’s done here, is a much better approach. (And in our humble opinion, spreading bets across multiple parameters, as we do with portfolio tranching, is the best approach).
Further, that nasty drawdown of -19.9% that Trinity would have suffered during the Global Financial Crisis (2008-09) would have been simple enough to avoid (in hindsight) with the right mix of asset classes (ex. more treasury exposure and less corporate bond exposure). But that would be designing a strategy for the last crisis. Faber has instead employed a logical, unbiased asset universe derived from the Global Market Portfolio. Obviously we agree with this unbiased approach. We used a GMP-derived asset universe in our own test of various portfolio optimization techniques.
Faber also understands a fundamental truth about investor behavior: that investors often abandon their best laid plans, usually at the worst possible moment. A portfolio that is split between both static and dynamic approaches can be psychologically easier to trade in the real-world, even if it hasn’t performed as well historically. While investors say that they want “absolute” returns that are uncorrelated to the broader market, in reality, most investors want “outperformance on a relative basis”. Most investors are happy being down, as long as they’re down less than the broader market. Conversely, most investors are unhappy being up, if they’re up less than the broader market. The static half of the portfolio ensures that portfolio returns are more closely tied to market returns, and thus, for many investors, psychologically easier to trade when momentum is out of favor.
A big thank you to Meb Faber for the opportunity to put this strategy to the test. Visit Cambria Investments to learn more about the original Trinity Portfolio.
We invite you to become a member for about $1 a day, or take our platform for a test drive with a free limited membership. Members can track the industry’s best tactical asset allocation strategies in near real-time, and combine them into custom portfolios. Have questions? Learn more about what we do, check out our FAQs or contact us.
End notes:
A full list of differences between our test and the original white paper: (1) Faber’s model uses individual stocks to gain exposure to US momentum/value, and international value. We’ve used the ETFs: MTUM, IWD and EFV. (2) Faber’s model trades individual sovereign debt markets using the methodology found here. We’ve assumed all international treasury exposure is represented by BWX. (3) Throughout our site, we ensure that no strategy ever signals a position smaller than 2%. That’s because we assume that members are including the strategy as just one component of a custom model portfolio, meaning a position size of less than 2% could become impractically small. How does that affect this strategy? When US TIPS (TIP) is not selected by the momentum portion of the strategy, it’s only allocated 0.9% of the portfolio. In these cases, we shift that portion of the portfolio to long-term US Treasuries (TLT). This is an imperfect proxy for sure, but the allocation is so small that it’s had a negligible effect on performance.


