US Treasuries and other interest rate sensitive instruments form the backbone of many asset allocation strategies. Investors are justifiably concerned about a future of rising interest rates and the potential impact on those instruments. In this post we model that impact on constant maturity Treasury assets like the ETF TLT, which tracks long-term (20+ year) US Treasuries. For brevity, I’m going to skip the math used to calculate these numbers, but interested readers can find out more in the notes at the end of this post.
First, let’s look the simulated performance of TLT, from the interest rate peak in 09/1981 to the present. TLT is painted orange (left axis) and 30-year Treasury rates are painted blue (right axis). Note the consistency with which rates have fallen and TLT would have risen.
There are two main drivers of returns for constant maturity assets like TLT: changes in interest rates (declining rates drive prices up, and vice-versa), and the coupon payment itself. The former benefits from falling rates, and the latter benefits from high rates (regardless of whether they are rising or falling).
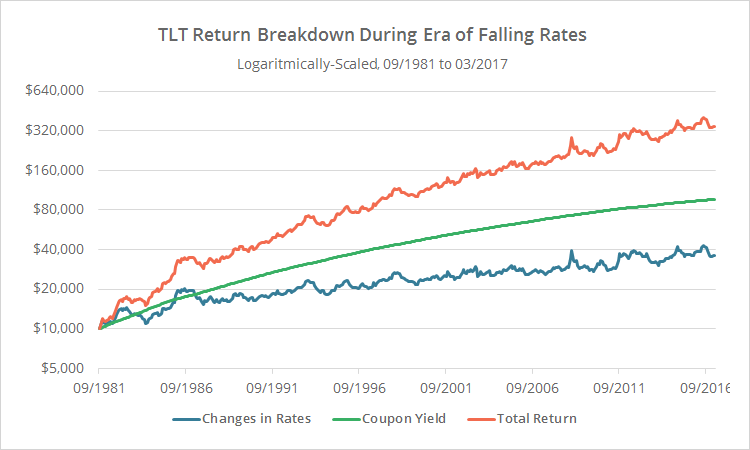
How much of the gain in TLT over the last 35+ years was a result of each of those return drivers? Here’s a great piece from Newfound Research looking at that question. We use a different approach, but come to the same conclusion: nearly two-thirds of TLT’s return since interest rates peaked has been the result of high interest rates, not falling interest rates.
To illustrate, the graph below breaks down TLT’s total return (orange), into its two main drivers: changes in rates (blue) and the coupon yield (green). Note how rate changes are responsible for TLT’s volatility, but the coupon yield has provided most of the meat.
A Thought Experiment: Rates in Reverse
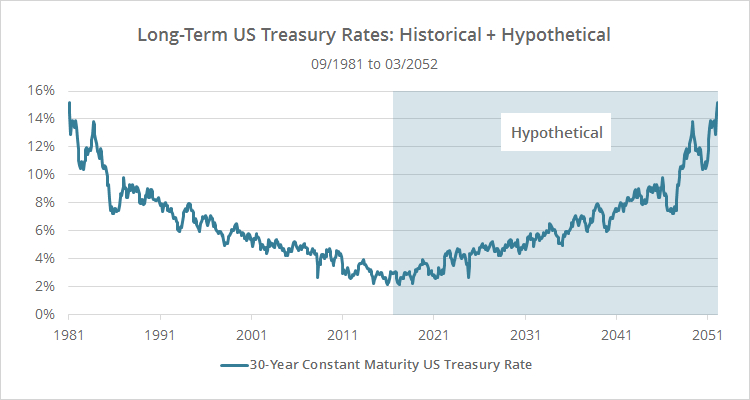
Obviously, no one knows what the next 35 years will bring for interest rates, but here’s a little thought experiment. What if rates marched upwards over the next 35 years in the reverse order that they fell over the previous 35? In other words, what if rates looked like this:
There’s no reason to expect that to be the case. Rates tend to rise and fall at different speeds and for entirely different reasons. This is simply an attempt to model the interplay between the two main drivers of return in a rising rate environment.
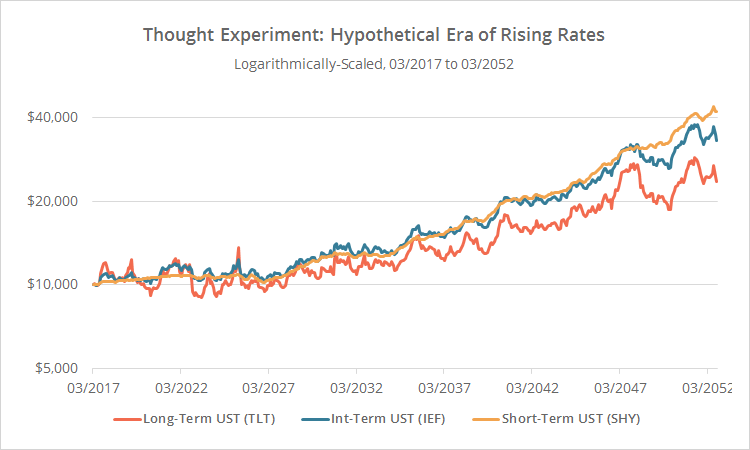
Below we’ve modelled that for three US Treasury ETFs: TLT (long-term, 20+ years), IEF (intermediate-term, 7-10 years) and SHY (short-term, 1-3 years).
Depending on your previously held beliefs, this graph may either be more or less pessimistic than you expected. We don’t see a steep sustained decline in prices as some fear (that’s the good news), but returns are essentially flat for the next 15 years (that’s the bad news).
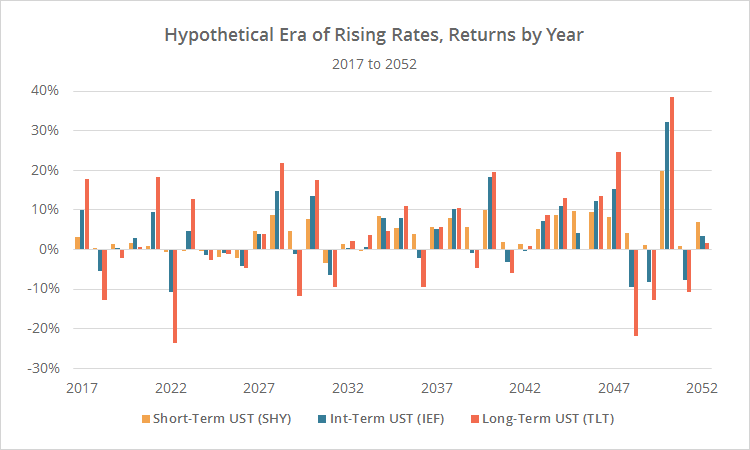
Below we show annual returns for our three assets. Note that Treasuries would not begin consistently winning again until about 2032.
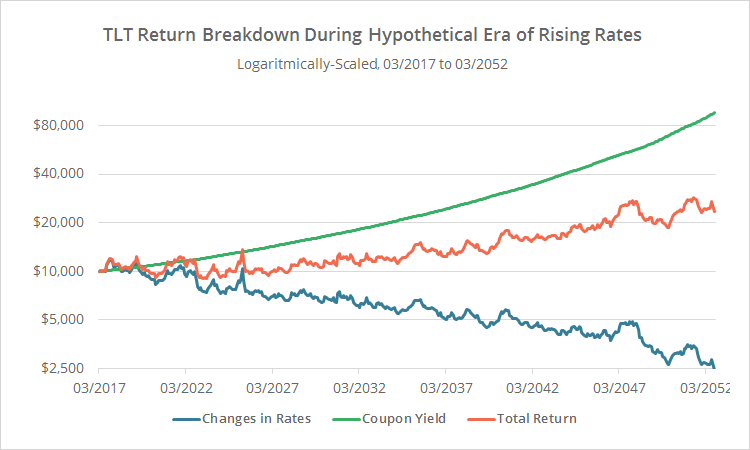
If coupon yield has been the biggest return driver historically, why do these Treasury assets perform so poorly in our hypothetical era of rising interest rates? Because unlike the rising rate environment of the 1970’s, yields are so low today that they can’t make up for rising rates’ drag on bond prices. To illustrate, below we show the same return breakdown for TLT that we showed previously. Note how the change in rates (blue) is a constant drag on performance that the initially anemic coupon yield (green) can’t cover.
What does this future of blah returns mean for investors employing tactical asset allocation (TAA) strategies? We provide a number of tools to help members answer that.
 Not all strategies carry the same exposure. I’m not referring just to the amount of time a strategy spends in Treasuries and other rate sensitive instruments, but whether it has the ability to rotate in and out of those instruments when they out/underperform. Members can capture both using the “Historical Allocation” report that we attach to every backtest, and the new “Filter by Category” feature that categorizes strategies by low, medium or high exposure to rising rates.
We invite you to become a member for less than $1 a day or take our platform for a test drive with a free limited membership. Members can analyze and follow the industry’s best tactical asset allocation strategies in near real-time, and combine them into custom portfolios. Have questions? Learn more about what we do, check out our FAQs or contact us.
Calculation notes:
We simulated returns for constant maturity instruments using the formula below. This example uses monthly interval data. For simplicity, we’ve ignored fund expenses and other less significant return drivers.
currentPrice = previousPrice * (((((previousRate * (1 – (1 + currentRate) ^ (maturityYears * -1)) / currentRate) + (1 / (1 + currentRate) ^ maturityYears) – 1)) + (average(previousRate, currentRate) / 12)) + 1)
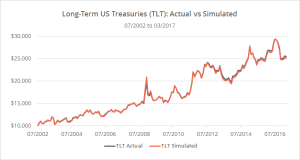 In the graph to the right (click to zoom), we show the actual TLT (grey) versus our simulation (orange) since TLT’s inception. Note the tight fit (correlation = 99.3%). We see a similar high degree of fit comparing our simulation to other relevant indices with longer histories like DBUS20VL.
Further reading:
This post was inspired by some reading we’ve been doing over at Think Newfound’s excellent blog Flirting with Models. Here are some additional thoughts from their team:

