This strategy from NLX Finance is an alternative version of a strategy we’ve covered previously: Dr. Keller & Keuning’s Hybrid Asset Allocation (HAA).
It trades based on all the same rules as the original HAA with one exception: rather than allocating 100% to US stocks when risk on, it holds a 60/40 mix of US stocks and Treasuries.
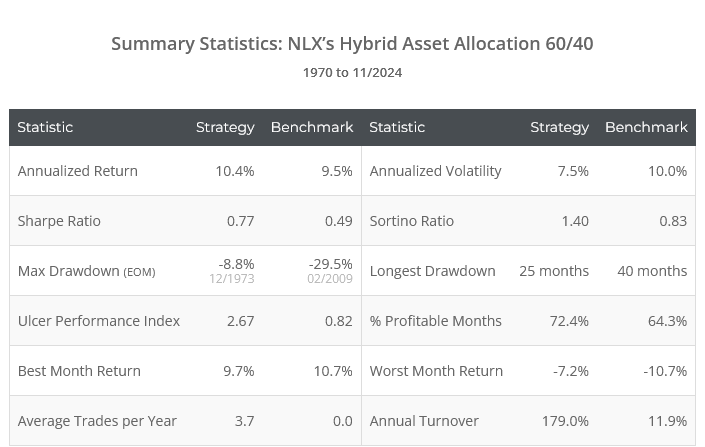
Strategy results from 1970 follow. We perform a much longer test back to 1901 later in this analysis. Results are net of transaction costs – see backtest assumptions. Learn more about what we do and follow 80+ asset allocation strategies like this one in near real-time.
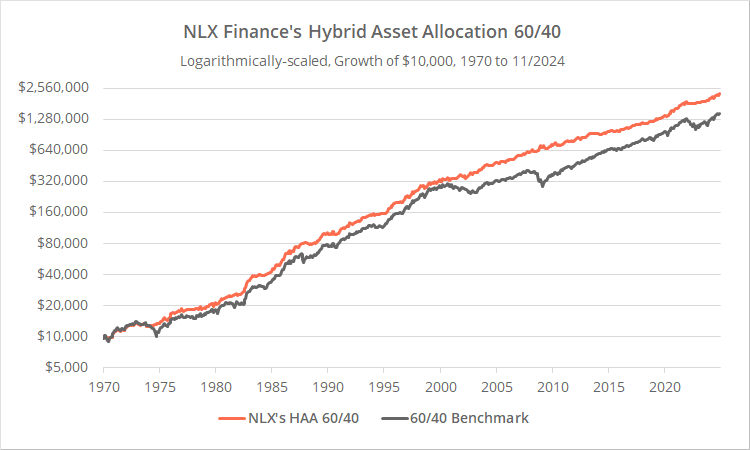
Logarithmically-scaled. Click for linearly-scaled results.
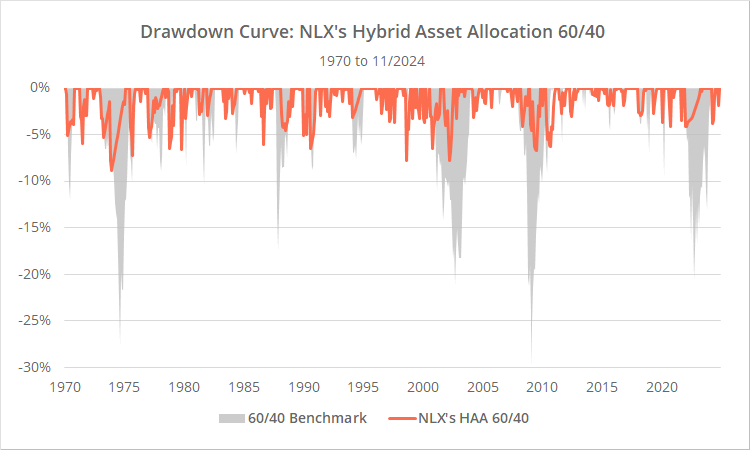
NLX’s strategy would have produced returns similar to simply buying & holding the 60/40 benchmark, but at significantly reduced risk. Note the reduction in volatility and taming of drawdowns in the results below.
We’re not going to cover the rules of the strategy in this article because they are almost identical to our previous test of HAA-Simple. The only difference between the strategies is when risk on, NLX’s version allocates 60% of the portfolio to US stocks (represented by SPY) and 40% to intermediate-term US Treasuries (IEF).
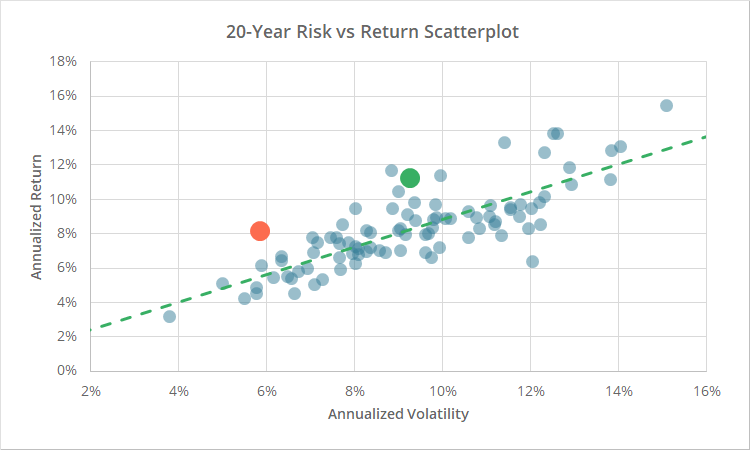
To give a visual sense of the impact of that change, below we present a scatterplot of return (y-axis) versus risk (volatility, x-axis) over the last 20 years for the 80+ strategies we track (see the full report). The green dot represents HAA-Simple and the orange dot NLX’s HAA 60/40.
This change has taken the strategy from a moderate volatility strategy (1) to a relatively conservative one, with a commensurate reduction in return.
Better as a standalone solution, but maybe not as a combined solution:
The core observation behind HAA is that momentum in US Treasuries (specifically TIPS) is useful for timing risk assets (specifically US stocks). This is so called “cross-asset momentum”.
We’ve covered other strategies that leverage this same observation (example), and we are proponents of the idea. Note that we are not proponents of going “all in” on this one observation, because like all market observations, its effectiveness will ebb and flow over time. We do think however that it deserves to be one component of a diversified Model Portfolio.
If an investor was going to trade just a single TAA strategy, we think NLX’s alternative is superior to the original HAA. Allocating 100% of the portfolio to any asset other than short-term T-Bills is not a level of risk we’re comfortable with.
However, if the strategy is just one component of a diversified Model Portfolio, we think the original HAA-Simple may be the better choice. It’s a purer play on risk exposure with less correlation to other strategies we track, and the investor is likely getting some level of offsetting exposure at any given time from other strategies in the portfolio.
This is why you’ll note that, despite producing similar risk-adjusted returns (ex. Sharpe Ratio), the original HAA is much more likely to be chosen by the Portfolio Optimizer.
Data quality of historical TIPS data:
This strategy uses TIPS to determine the current risk state of the market. Actual US TIPS did not exist prior to 1997. More so than any other asset class we cover, historical TIPS simulations should be taken with an extra-large grain of salt. They are a best guess.
As we do whenever we test a strategy that relies heavily on TIPS, we performed a more adversarial test using US Treasuries (IEF) in place of TIPS. We’re not showing those results here for brevity, but they are in line with our original test of HAA; slightly inferior results, but not so inferior that they call the results of the backtest into question.
That should give investors a level of confidence that the strategy’s success has not been a result of wonky TIPS data.
Extended backtest from 1901:
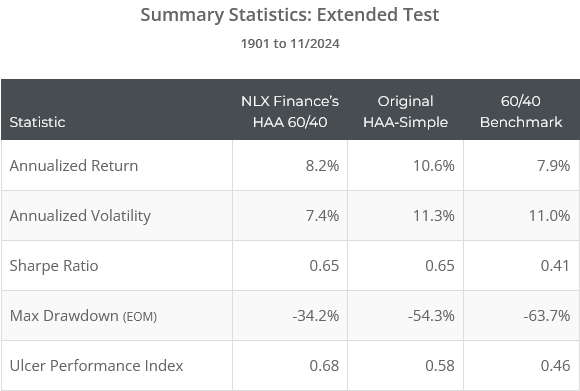
Below we’ve provided a 120+ year test of NLX’s HAA 60/40 (orange), the original HAA-Simple (blue) and the 60/40 benchmark (grey).
Asset data quality so far in the past is inherently more suspect than contemporary data. These extended results should be treated as a useful datapoint but shouldn’t be considered as reliable as our earlier shorter test.
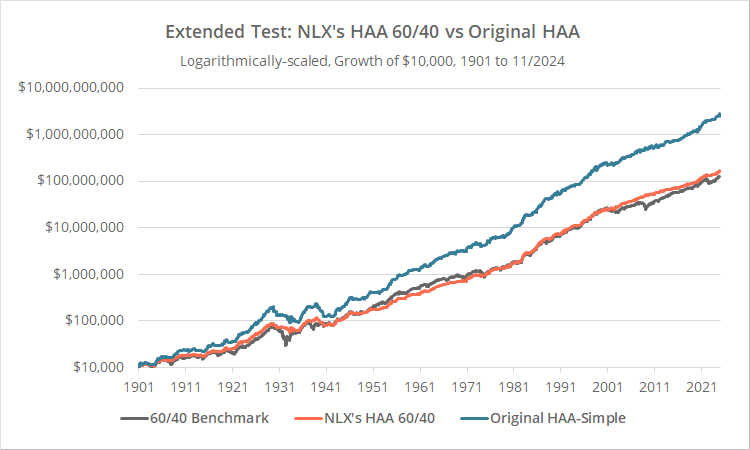
Logarithmically-scaled. Click for linearly-scaled results.
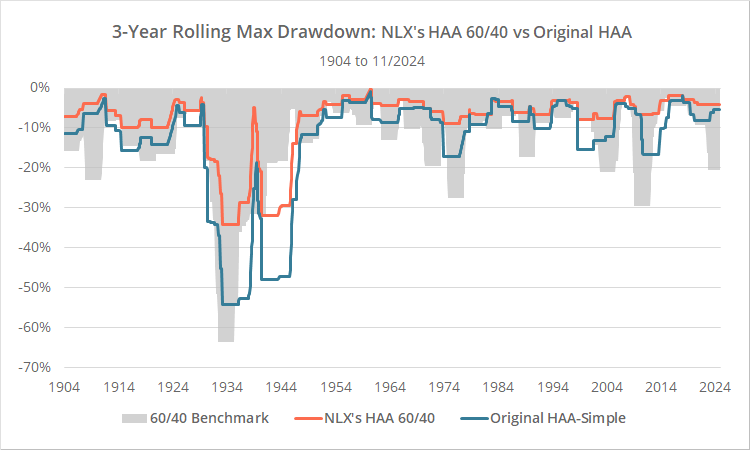
Note: To make the drawdown graph below more readable, we’re showing the rolling 3-year max drawdown rather than simply the max drawdown at that point in time.
From a 30,000 foot view, these results are largely inline with the shorter results presented earlier in terms of performance relative to the benchmark.
NLX’s HAA 60/40 would have produced benchmark-like returns at significantly less risk, while the original HAA-Simple would have exhibited benchmark-like risk with significantly higher return.
Two big exceptions:
- The years surrounding the Great Depression. The 60/40 benchmark would have lost 63.7% (05/1932). HAA-Simple would have barely pared down that loss, falling 53.2% (04/1933). NLX’s HAA 60/40 would have lost 34.2%. That’s a significant improvement, but it still did far worse sidestepping this drawdown than in most of the remaining test.
- Both variations of HAA would have again suffered major drawdowns around 1940 that far exceeded the 60/40 benchmark. This was a case of very nasty “whipsaw”, or repeatedly being on the wrong side of the market in the short-term (i.e. in and the market fell, out and the market rose).
Are these black marks on either strategy? Sure, but not enough to reject either.
The Great Depression was obviously an extreme market event in a market that was very different than ours today. Lots of strategies would have failed to perfectly navigate those years. Over the vast majority of the 120+ year test, including the years prior to the Great Depression, these strategies performed in line with more recent expectations.
It is however an illustration of the importance of combining multiple strategies together into what we call Model Portfolios, to ensure investors are protected when a particular strategy goes off the rails like this.
In particular, that big drawdown around 1940 that greatly exceeded the benchmark is definitely a case of “going off the rails”. We don’t see a similar drawdown around that time in most other strategies we’ve tested, making it really a case of these particular strategies being ill-tuned to the market for that relatively brief period. Investors should try to diversify away that kind of strategy-specific risk.
Other highlights:
Explore our members area to find other key differences between NLX’s HAA 60/40 and the original, such as our Tax Analysis (NLX is superior), Withdrawal Rates (inferior), and Exposure to Rising Interest Rates (inferior).
New here?
We invite you to become a member for about a $1 a day, or take our platform for a test drive with a free membership. Put the industry’s best Tactical Asset Allocation strategies to the test, combine them into your own custom portfolio, and follow them in real-time. Learn more about what we do.
* * *
(1) “Moderate volatility” in terms of long-term historical volatility. In any given month, the original HAA-Simple could allocate 100% of the portfolio to US stocks, making it potentially riskier than the long-term volatility measurement would indicate.
Calculation notes:
- All calculations throughout this article are based on each asset’s dividend-adjusted closing price.
- As in the authors’ original paper, for all years prior to EOY 1973, we used int-term US Treasuries (IEF) in place of TIPS due to a lack of historical TIPS data.
- All positions are assumed to be rebalanced monthly, even if there isn’t a change in allocation.
