Readers have asked for our take on “the single greatest predictor of future stock market returns”, aka the Aggregate Investor Allocation to Equities. This indicator was first shared by Philosophical Economics back in 2013, and recently resurrected by Portfolio Optimizer (two excellent sites you should be following).
A very brief primer:
The Aggregate Investor Allocation to Equities (AIAE) indicator is calculated as the total market value of stocks held by investors, divided by the total market value of stocks + bonds + cash, based on quarterly data from the Federal Reserve. For technical details, read this and this.
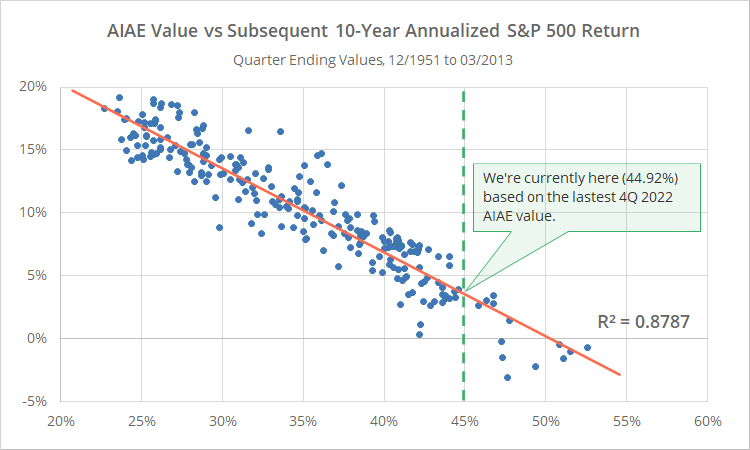
The AIAE has done an exceptional job for more than 60 years of predicting long-term stock market returns. In the graph below we’ve shown all quarterly AIAE values since 12/1951 and the subsequent 10-year annualized return of the S&P 500 (dividend-adjusted).
Calculation note: The results above are based on our homegrown analysis using vintaged economic data, but they closely match other sources.
As far as this type of long-term economic model is concerned (others including CAPE, Tobin’s Q, etc), the AIAE indicator’s predictive performance has been very impressive. We’d go so far as to say it’s the most predictive such economic model we’ve encountered, and this detailed study from Raymond Micaletti agrees. In that sense, AIAE’s crowning as the “single greatest predictor of future stock market returns” is well earned.
The green line represents where the AIAE indicator stands today. It forecasts returns over the next 10 years of roughly 3.7% annually (not great).
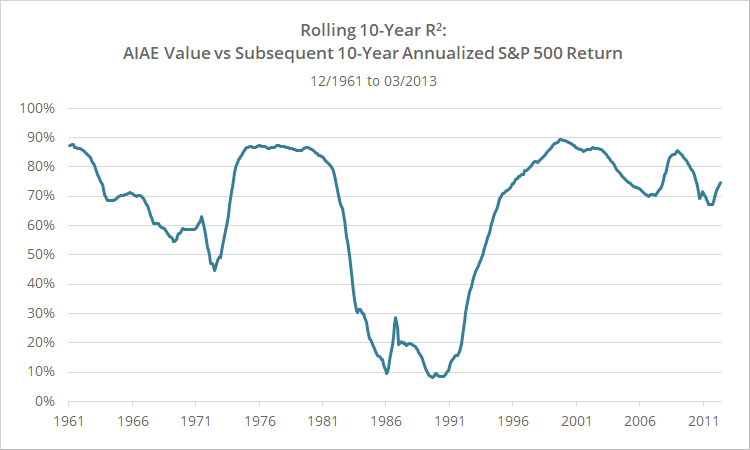
We don’t want to oversell. The indicator’s effectiveness has waxed and waned over time. Below is the rolling 10-year R2 of the AIAE indicator versus subsequent 10-year annualized return.
Note how the indicator went through long periods of reduced effectiveness, especially in the 1980’s.
Our take: Informative and interesting, but too blunt an instrument:
A major problem (*) with these types of economic models is converting them to an actionable signal. Knowing that the general environment for equities will likely be tepid over the next 10-years is interesting, but what do we do with that information now…today.
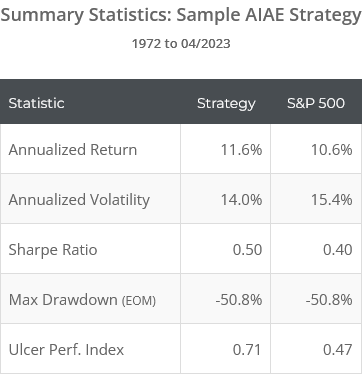
Below is a simple, common-sense strategy applied to the S&P 500 from 1972. We’ll discuss more sophisticated approaches in a moment.
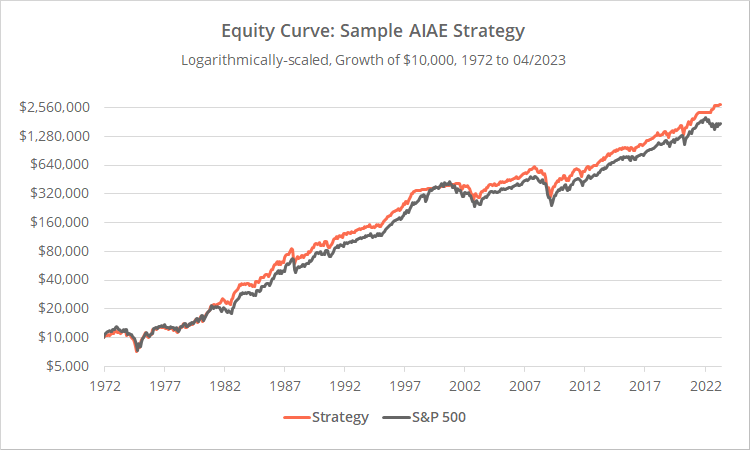
Logarithmically-scaled. Click for linearly-scaled results.
Simple strategy rules:
- At the close on the last trading day of each month, determine the most recent AIAE value (which may be lagged by up to 5 months).
- Forecast annualized stock market returns over the next 10-years based on an ordinary least squares (OLS) regression using all available monthly data from inception to that point in time. In other words, we’re walking our OLS regression forward (no lookahead bias).
- Adjust our forecast based on the stock market’s performance from the last economic data point (≤ 5 months ago) to today, to account for how much the market has moved since (as was done by Micaletti). This step didn’t have a large impact, but felt more analytically sound.
- If our forecasted annual return is greater than the yield on US T-Bills, go long the S&P 500 at the close, otherwise hold T-Bills. Hold the position until the close of the following month.
Our sample strategy would have been long almost 87% of the time. That’s encouraging because that’s roughly the time-in-market we see from long-term trend-following strategies. And the sample strategy would have provided some value over buy & hold in terms of improving risk-adjusted performance (Sharpe and UPI).
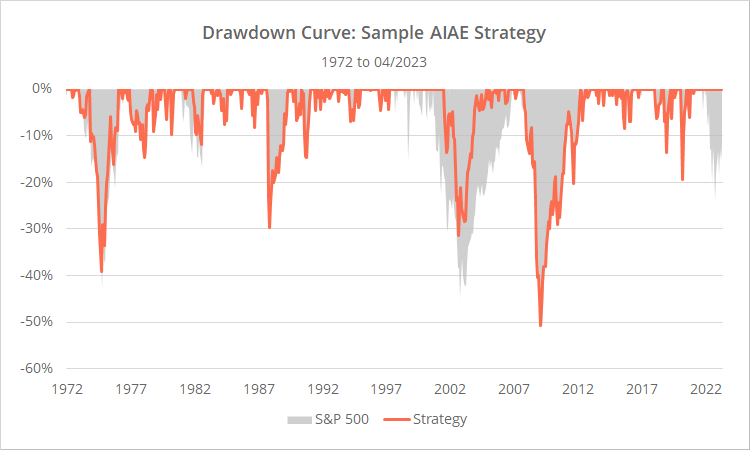
But that benefit has been marginal at best. Most importantly, the very long-term nature of the strategy means that it has no mechanism to avoid major stock market downturns, which tend to arise too suddenly and proceed too quickly for the indicator to respond to.
The most glaring example is the 2007-08 Global Financial Crisis when the AIAE indicator (at least as we’ve interpreted here) would have ridden the market all the way down into the abyss.
Drawdown management is key to successful investing in the real-world. Major losses cause investors to abandon their best laid plans, usually at the worst possible moment by selling low.
More sophisticated approaches:
Micaletti provides a more sophisticated approach for interpreting the AIAE indicator as a tactical asset allocation strategy in his paper Towards a Better Fed Model.
We didn’t replicate his specific approach, but based on Micaletti’s own results, we wouldn’t expect to come to a different conclusion than we did with our simple strategy. Micaletti’s results are a bit better, but the fatal flaw of short-term drawdown management persists.
Asness, et al. provide their own approach to tactical trading with CAPE in Market Timing: Sin a Little. We replicated that approach applied to the AIAE indicator, and again, came to a similar conclusion.
Could there be an opportunity to merge these approaches with conventional momentum and trend-following strategies to fix this drawdown management issue? Absolutely, but that’s beyond the limits of what we do (we’re the independent scorekeeper and leave the strategy creation to others).
In short:
The AIAE indicator has been extremely effective at predicting long-term future stock market returns. It just might be the “the single greatest predictor of future stock market returns”. However, like other similar long-term economic indicators, such as CAPE, it has been difficult to translate that into an actionable signal relevant to now.
That’s especially true when we compare it to conventional tactical strategies, which tend to be shorter-term in nature and more reactive to market prices.
New here?
We invite you to become a member for about a $1 a day, or take our platform for a test drive with a free membership. Put the industry’s best tactical asset allocation strategies to the test, combine them into your own custom portfolio, and follow them in real-time. Learn more about what we do.
* * *
(*) Geek note: The other major problem with these types of indicators is determining what constitutes a high or low value, without the benefit of hindsight. Many indicators fail when walked forward using only the data available at that moment in time. That make us less confident that whatever we conclude are the relevant high/low values today, will continue to be so in the future. Importantly, that does not appear to be the case with the AIAE indicator as the slope/intercept of our OLS regression were relatively consistent throughout our test. That’s a feather in the cap for AIAE.
