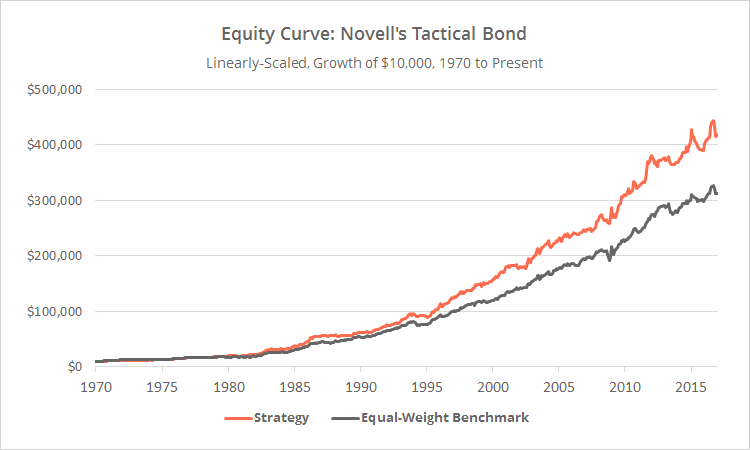
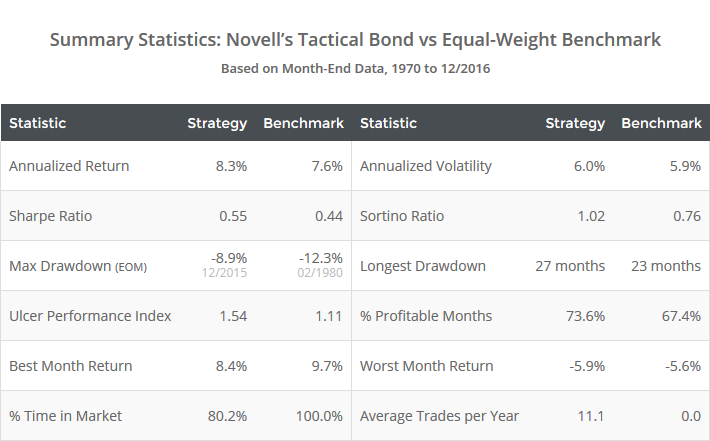
This is a test of a tactical bond strategy from Paul Novell of Investing for a Living. The model rotates among a broad basket of bond asset classes based on rules similar to Gary Antonacci’s Dual Momentum. Results from 1970, net of fees, follow.
Read more about our backtests or let AllocateSmartly help you follow this strategy in near real-time.

Linearly-scaled. Click for logarithmically-scaled chart.
Paul Novell filled a role similar to Allocate Smartly long before our site was a twinkle in the eye. Paul cataloged and tracked a number of tactical asset allocation strategies, many of which you’ll find on our site today. He has since turned that duty over to the pros, but remains one of our biggest supporters. I highly recommend you follow him now.
About this strategy:
These rules are simple, but it’s important to note that this test includes a few more gotchas than most we cover. More on that in a moment. See the end notes for a list of differences between these results and those shown by Paul. The strategy rules tested:
- At the close on the last trading day of the month, calculate the 6-month return for the following bond assets: SHY, IEF and TLT (short, intermediate and long-term US Treasuries), TIP (TIPS), LQD (US corporate), HYG (US high yield), BNDX (international aggregate) and EMB (emerging market bonds).
- Select the 3 assets with the highest 6-month return. For each, if the return is both positive and greater than the 6-month return of BIL
(3 month US Treasuries), allocate 1/3 of the portfolio at the close, otherwise allocate that portion of the portfolio to cash. - Hold positions until the final trading day of the following month. Rebalance the entire portfolio monthly, regardless of whether there is a change in position.
Note the similarities between these rules and Gary Antonacci’s Dual Momentum. Both employ relative (aka cross-sectional) momentum by choosing the highest returning assets from a basket, as well as absolute (aka time series) momentum by requiring each selected asset meet some minimum hurdle.
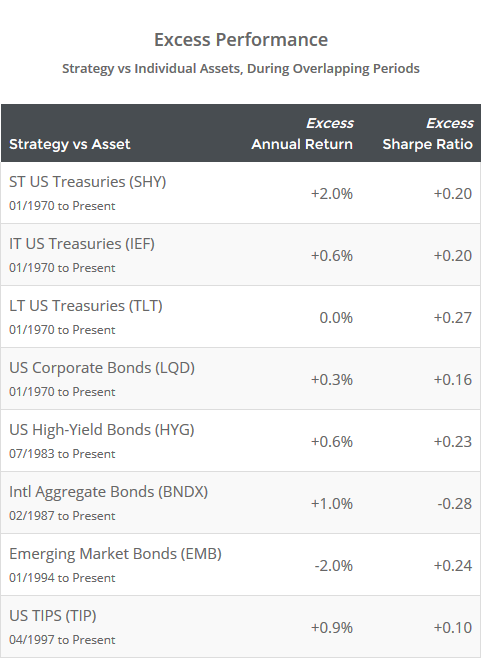
As we’ll discuss in a moment, data is not available for some of the assets traded over the entire 47+ year test. The benchmark shown above assumed an equal allocation to whatever assets were live as of that moment in time. The table below shows how the strategy stacked up against each individual asset during overlapping periods. Note that we’ve shown the strategy’s excess performance, so positive numbers indicate that the strategy outperformed that asset. The strategy beat all assets in terms of raw return except for emerging market bonds (EMB), and all in terms of Sharpe Ratio except for international aggregate bonds (BNDX).
Test bugaboos:
The biggest difficulty in accurately testing this strategy is data, or the lack thereof.
All tactical bond strategies should be tested through an extended period of rising interest rates, like the US in the 1970’s. Even that era is an imperfect proxy because rates were rising from a much higher base, meaning there was more current yield to offset the effect of rate increases, but it’s certainly better than nothing.
The problem is that only four of the assets traded have data covering the 1970’s: three of the US Treasury assets (SHY, IEF and TLT) and US corporate bonds (LQD). Granted, those four asset classes are the most significant of the group from a US investor’s perspective in terms of assets invested, but they miss some key return drivers: (a) high-yield exposure, which is often more equity-like than bond-like, and (b) international exposure as a diversifier.
In short, due to data limitations and the fact that the 1970’s are an imperfect proxy for an extended period of rising rates beginning today, a healthy dose of extra skepticism is probably in order.
Observations:
Unlike most TAA strategies, most tactical bond strategies haven’t significantly outperformed over the last few decades. The tailwinds of a steady march downward in interest rates has meant that any strategy has had difficulty in providing much more value than buy & hold. The real benefit of these strategies has been in the ability to produce those returns while still having a safety valve in place when (not if) we enter a new regime of rising rates.
Published work on tactical bond strategies like this one is thin. I look forward to adding more to this site for two reasons:
First, most of the strategies that we track have significant equity exposure, and there’s inherent value in diversifying that exposure. Monthly correlation between this strategy and equities (represented by SPY) has been just 0.19. This strategy could still have equity-like exposure in any given month (via HYG, LQD and EMB), but much less so than most of the strategies that we cover.
Second, as previously discussed, strategies like this provide a potential solution to the long feared return to an extended period of rising interest rates. Some of the tactical asset allocation strategies that we track treat bond exposure as the “fallback” allocation. In other words, when the strategy is not long “risk on” assets like equities or real estate, it dumps that exposure into bonds. Of course, that makes less sense in a regime of rising rates. I would prefer to see those strategies take an approach more like the one here. A good example of that can be found in our post on the PAA vs PAA-CPR strategies.
Summary:
Paul Novell’s Tactical Bond strategy trades a broad basket of bond asset classes based on rules similar to Gary Antonacci’s Dual Momentum. The strategy outperformed most constituent bond assets over our test, but more importantly, could act a safety valve should we enter a new regime of rising interest rates. However, due to data limitations and the lack of a good proxy for a new regime of rising rates beginning today, a healthy dose of extra skepticism about these results is probably in order.
We invite you to become a member for less than $1 a day to track this and other excellent models in near real-time, or take our platform for a test drive with a free limited membership. Have questions? Learn more about what we do, check out our FAQs or contact us.
End notes:
There are a number of differences between our results and those shown by Paul. None are major by themselves, but taken as a whole, could lead to significant differences in any given month. We think over time these differences will come out in the wash.
- Paul’s results assume (a) that trades are taken every four weeks as opposed to every month end, and (b) that trades were taken at the following day’s close. Both are simply limitations of Paul’s backtesting software. He’s indicated that he prefers the month end/same day trade and we’ve tracked it that way here to better match other strategies on this site. Note that we are able to track the strategy with signal and execution at the same close because our signal is updated in near real-time throughout the day for members.
- Paul’s results only require that an asset have a positive return to pass the “absolute” (aka “time series”) momentum test. We’ve required that the asset have both a positive return and a return greater than the 6-month return of BIL. This had a slight positive impact on historical returns.
- Both our results and Paul’s use BWX (international treasuries) in place of BNDX (international aggregate bonds) prior to BNDX data becoming available, but because we have access to much more simulated BNDX data, BWX plays much less of a role in our test.
- As we do throughout this site, we’ve assumed that any trades signaled for SHY (short-term US Treasuries) were instead placed in “cash” (equal to the 3-month UST rate). We feel it’s a more appropriate choice in today’s environment of low interest rates given transaction costs and how frequently this strategy trades. This did not have a significant impact on historical returns.

