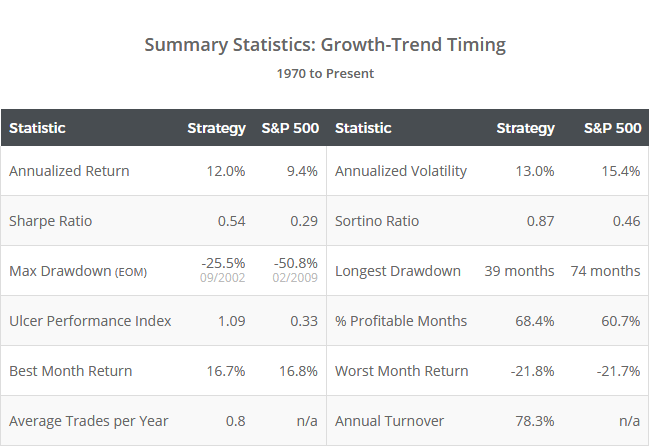
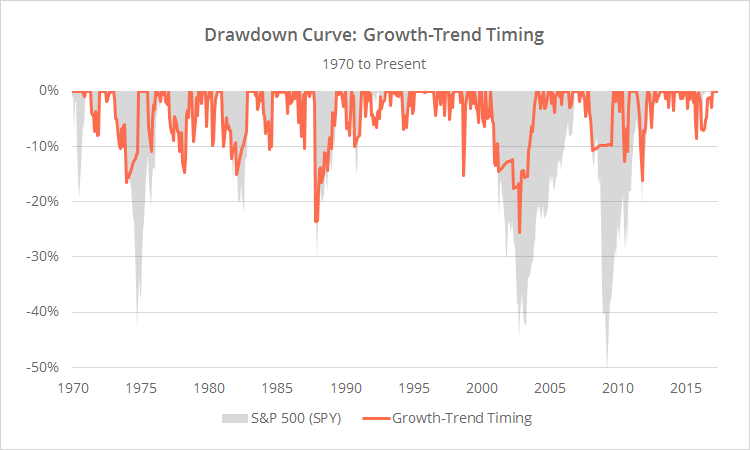
This is a test of the Growth-Trend Timing (GTT) model from the always thought-provoking Philosophical Economics. GTT combines trends in price and key economic indicators to switch between US equities and cash. Results from 1970, net of transaction costs, follow.
Read more about our backtests or let AllocateSmartly help you follow this strategy in near real-time.

Logarithmically-scaled. Click for linearly-scaled chart.
If you don’t follow Philosophical Economics, I highly recommend that you do so now. Where PE differs from other authors is an extreme focus on the mechanics that underlie strategies, as opposed to simply (potentially overfit) results. The source piece for this strategy is a masterwork in understanding trend-following.
A key takeaway is that trend-following strategies based on price alone do a good job determining when to switch to defensive assets inside of recessions, but a poor job outside of recessions. If we have a means to judge when the economy is entering/exiting a recessionary period, we’ll know when to turn trend-following on/off. PE uses two key economic indicators that have been strongly predictive of past recessions to make that determination.
Strategy rules tested:
- At the close on the last trading day of the month, calculate the year over year change in Real Retail and Food Services Sales (RRSFS, a measure of economic consumption) and the Industrial Production Index (INDPRO, a measure of economic production) as of the end of the previous month. The one month lag is required due to the delay in the reporting of these numbers.
- If the YOY change in both indicators is positive, go long the S&P 500 (represented by SPY) at the close. In other words, no recession is signaled, so turn trend-following off.
- If the YOY change of either indicator is negative, compare the S&P 500 (SPY) to its 10-month moving average. If the S&P 500 will close above the average, go long SPY at the close, otherwise move to cash. In other words, possible recession is signaled, so rely on price to confirm. Note that this is the same trend-following rule used in Meb Faber’s classic GTAA.
- Hold positions until the final trading day of the following month.
Calculation note: Economic data, like that used by this strategy, is often initially reported at one value and then later restated (sometimes multiple times). That could cause a change in position from what was originally reported. This is a risk inherent in trading based on economic data. The historical results shown here are based on the economic data as it looks today.
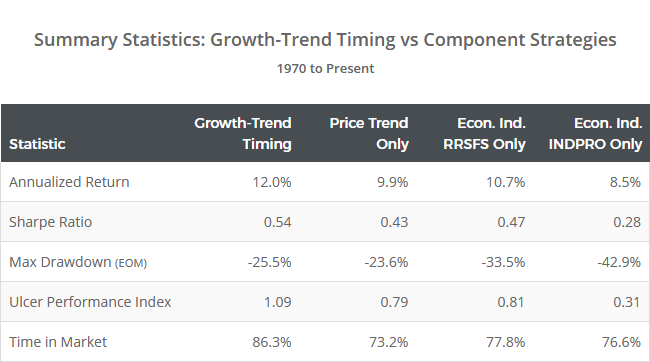
Why not just base the entire strategy on the economic indicators? Because they often signal weakness too early. The price-based indicator is required to confirm that weakness. To illustrate, below we test other variations of the strategy, based on each component of the strategy in isolation:
Note the superior performance of GTT’s combined approach, and the significant increase in time spent in the market. The difference between GTT and RRSFS/INDPRO is even more pronounced in Philosophical Economics’ longer test.
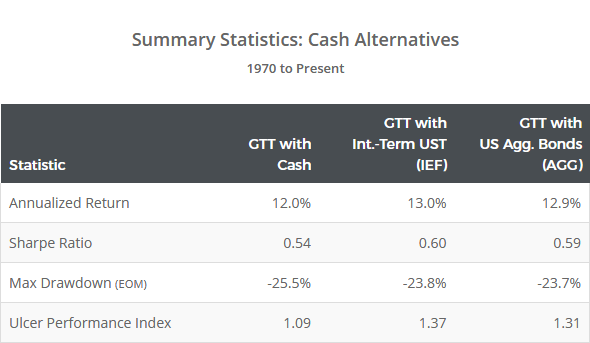
This strategy is unlike most that we track, in that it only switches between two assets: the S&P 500 and cash. Because I know that readers will ask: had we replaced cash exposure with US Treasuries (represented by IEF) or a US Aggregate index (AGG), strategy returns would have increased by 1.0% and 0.9% per year respectively. Of course, given current rates, it’s debatable as to how relevant that is to today’s market.
It would be very interesting to see this concept expanded to include other asset classes, each with their own relevant economic indicators, in order to create a more diversified portfolio. Philosophical Economics’ observation regarding how price-based trend-following is affected by the state of the economy is an important one that I’d like to explore further. Expect to see more strategies that make use of fundamental data like this added to Allocate Smartly in the coming months.
Thank you to Philosophical Economics for all of their fine work and for the opportunity to put this model to the test. For readers interested in thorough, empirically-oriented, outside-the-box thinking on investing, I highly recommend following Philosophical Economics now.
We invite you to become a member for less than $1 a day, or take our platform for a test drive with a free limited membership. Members can track the industry’s best tactical asset allocation strategies in near real-time, and combine them into custom portfolios. Have questions? Learn more about what we do, check out our FAQs or contact us.


