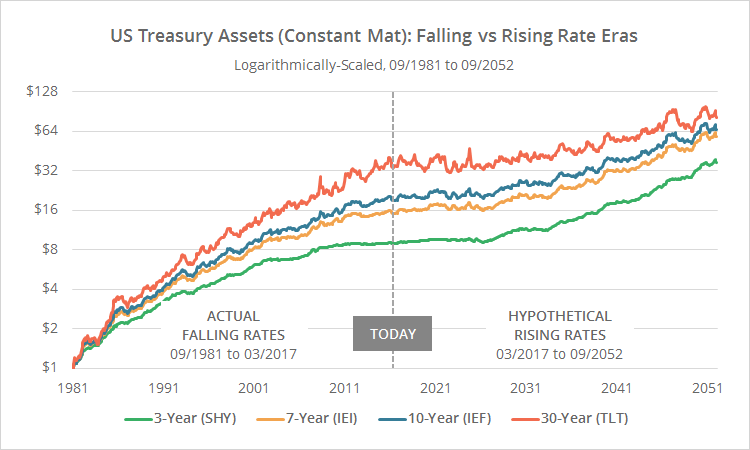
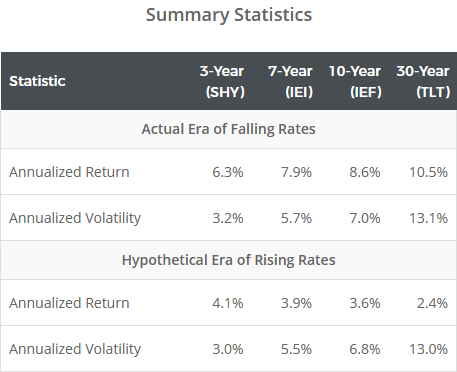
In our previous post we demonstrated an approach to modeling US Treasury ETF performance in an era of rising interest rates. We showed results like the ones below, simulating the performance of various constant maturity ETFs from the interest rate peak in 1981 to the present (left half of the graph), and in a hypothetical world where rates marched upwards in the exact reverse order (right half of the graph). The four ETFs modeled here are SHY (1-3 year Treasuries), IEI (3-7 year), IEF (7-10 year) and TLT (20-30 year).
See our previous post for the math behind these numbers. While no simulation is perfect, our approach has done a good job modeling the performance of these assets since their inception.
How well will our simulated future returns match reality? I wrote in my previous post that this was all purely hypothetical and that there was no reason to believe rates would march upwards in this fashion, but after a bit of thought, I’m less sure. Comparing our hypothetical progression in interest rates to the one following previous US interest rate lows (1941 and/or 1950), reveals a similar pattern. In other words, while these results are inherently wrong (because we don’t have a crystal ball), it’s entirely possible that they’re not that wrong.
The previous 35 years:
US Treasury ETF performance would have been extremely consistent in the last 35+ years from the interest rate peak in 1981 to today. There are two main drivers of returns for constant maturity assets like these: changes in interest rates (declining rates drive prices up, and vice-versa), and the coupon payment. The former benefits from falling rates, and the latter benefits from high rates (regardless of whether they’re rising or falling). The last 35+ years have benefited from both.
Longer duration assets (ex. TLT), when compared to shorter duration assets (ex. SHY), have exhibited higher returns as a result of a generally upward sloping yield curve, but also higher volatility as a result of their longer duration.
Choosing the right US Treasury ETF has mostly been a matter of choosing the one that matched the investor’s desired level of asset volatility; there were no wrong answers. However, given how low rates stand today, coupled with the fact that they can’t fall much farther from here, the next 35 years is guaranteed to be very different.
How to play US Treasury ETFs in an era of rising rates:
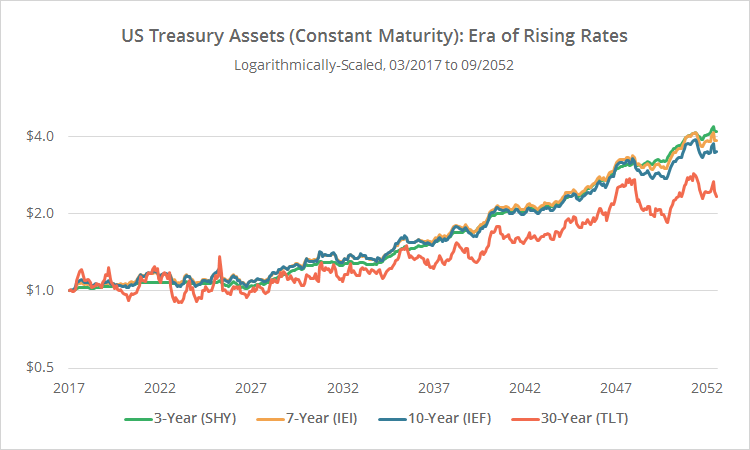
Below I’ve taken our original chart and zoomed in on just our hypothetical era of rising rates (today through the year 2052). To reiterate, this chart assumes that interest rates marched upwards over the next 35 years in the exact reverse order that they fell over the previous 35.
There are two important takeaways from this graph:
First, returns for all four ETFs are stagnant for the next 10+ years (see our previous post for returns by year). Rates are so low today that there isn’t enough coupon yield at the beginning of the simulation to overcome the impact of rising rates.
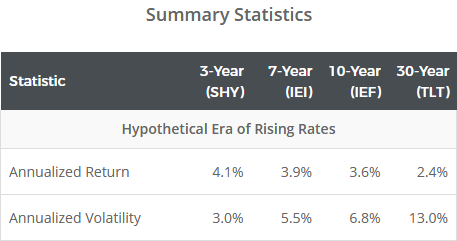
And second, longer duration US Treasury ETFs (ex. TLT) are now the worst performing, despite a generally upward sloping yield curve in our simulation. Making matters worse, as one would expect, longer durations also exhibit more volatility.
Combining those observations yields the following:
- If an investor intends to hold a US Treasury ETF for an extended period of time, shorter duration instruments may be superior to long. Returns may be higher (unlike in the past) and volatility will almost certainly be lower. Why would an investor want to hold Treasury ETFs at all given the abysmal results in our simulation? Because either…
- Rates may not rise as fast as our simulation assumed, meaning the meager coupon yield may be enough to generate positive returns.
- And/or because the investor is using Treasuries purely to reduce portfolio volatility (i.e. because they are negatively correlated to other assets traded).
- If an investor intends to actively trade US Treasury ETFs, holding them only for short periods of time, longer duration instruments may be just fine. Despite flat returns for the next 10+ years, higher volatility gives a successful trading strategy opportunity to profit from short-term swings.
- Here’s the rub though: US Treasuries assets are notoriously difficult to time. Conventional approaches to timing, like momentum and trend-following, mean-reversion, etc. tend not to work very well on Treasury assets. I realize that’s a pretty sweeping comment sans empirical evidence, but it’s something I’ve consistently found to be true over nearly two decades of quantitative trading.
- The other option of course is to look outside of US Treasury ETFs altogether for yield, including non-“constant maturity”, non-US, or non-government assets. That’s a big topic beyond the scope of this post that we’d like to save for a future discussion. Suffice to say however, many other bond assets suffer from the same curse of low yields that we’ve modeled here.
Of course, all of these suggestions assume that the hypothetical progression in interest rates in our simulation is reasonably correct. It’s entirely possible that rates languish here for years to come (making Treasury ETF returns slightly less tepid than what we’ve shown here).
What this means for the tactical asset allocation (TAA) strategies that we track:
 As a rule, we track TAA models as closely as possible to the author’s original intent. We don’t modify or override an author’s rules unless necessary to fit the framework of our site. Our role is to provide an independent platform for members to form their own conclusions.
Having said that, I personally would be wary of any strategy with high exposure to longer duration US Treasuries, especially TLT, and especially without a means to rotate away when they’re underperforming. We help members to capture that quantitatively with a feature that categorizes strategies based their exposure (low/medium/high) to rising interest rates.
If a strategy did signal a trade in long duration US Treasuries (again, especially TLT), I would consider replacing that with a shorter duration instrument, unless the strategy was specifically designed to time short-term swings.
And in the bigger picture, I would hope to see strategy authors doing more to take this type of analysis into consideration when developing strategies. Tactical asset allocation is here to stay; the underlying concepts have been far too successful for far too long to think otherwise. These concepts are not fleeting market anomalies that we expect to close tomorrow. They’re long-term observations that are intended to be traded over the course of years and decades. That long-term orientation inherently means that TAA will have to face a future of rising rates. It may not look like the one we’ve modeled here, but it will definitely not look anything like the last few decades.
We invite you to become a member for less than $1 a day or take our platform for a test drive with a free limited membership. Members can analyze and follow the industry’s best tactical asset allocation strategies in near real-time, and combine them into custom portfolios. Have questions? Learn more about what we do, check out our FAQs or contact us.
To clarify, the simulated data we show in this post is not the same simulated data that we use in strategy backtests. The data we use in strategy backtests (to simulate asset returns prior to the launch of each ETF) is based on price indices provided by third-party providers (Barclays, iBoxx, etc.). We are unable to use that more accurate data here because of the unique need to derive prices based purely on interest rates.


