This is a test of Dick Stoken’s Active Combined Asset (ACA) strategy from his book Survival of the Fittest for Investors. This tactical asset allocation strategy uses price channel breakouts to choose between pairs of opposing risk and defensive asset classes.
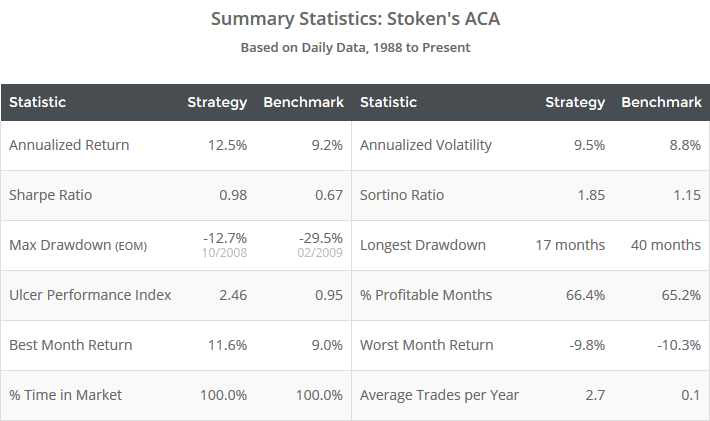
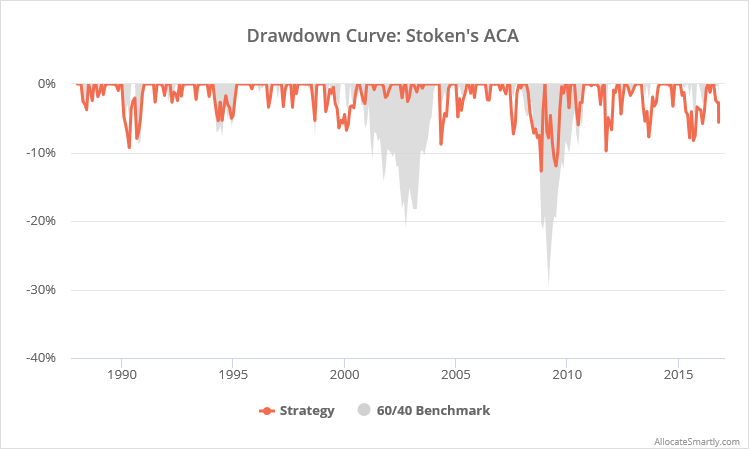
Results from 1988, net of transaction costs, follow. Read more about our backtests or let AllocateSmartly help you follow this strategy in near real-time.
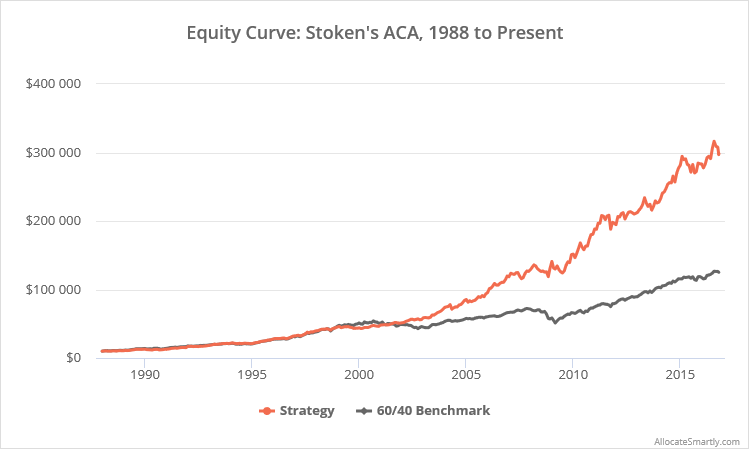
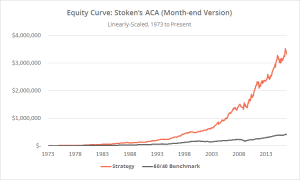
Linearly-scaled. Click for logarithmically-scaled chart.
Unlike most of the tactical asset allocation strategies that we track, which only trade once per month, this strategy could potentially trade daily. Practically-speaking however, the strategy has been one of the least active of any that we cover, trading less than 3 times per year.
Strategy rules tested:
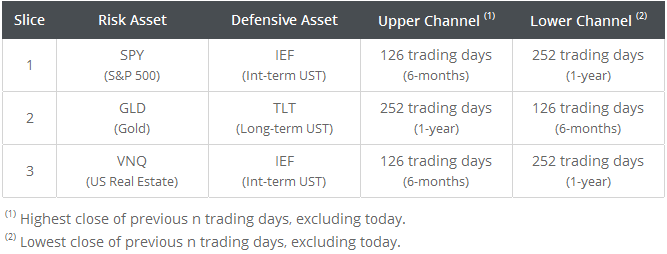
Divide the portfolio into three equal slices (1/3 each). Each slice uses price channel breakouts to choose between two opposing asset classes as shown in the table below.
Go long the “risk” asset at today’s close when the risk asset will end the day above its upper channel (highest close of previous n-days). Switch to the defensive asset at today’s close when the risk asset will end the day below its lower channel (lowest close of previous n-days). Hold positions until a change in signal. Rebalance the entire portfolio either on a change in signal or on the last trading day of the calendar year.
See the end notes for additional details about this test, and see our FAQs for backtest assumptions.
Commentary:
Much of Stoken’s book is devoted to linking elements of this strategy with Darwinian evolution. Such anecdotal narratives are beyond the scope (or care) of our empirically-oriented approach to trading. The far more important takeaway is that, despite the simple nature of the strategy, Stoken’s ACA has been one of the top performing strategies of any that we track, both in terms of absolute and risk-adjusted return.
Stoken’s book provides the theoretical underpinnings for selecting these particular pairs of assets, as well as the different lookbacks used by SPY/VNQ as opposed to GLD, so I’ll skip that discussion here.
While in most cases asset-specific lookbacks are a sign of overfitting to the data, I think that in this specific case it could be justified. The channel lookbacks chosen make it easier to enter (and more difficult to exit) positions in SPY/VNQ, but more difficult to enter (and easier to exit) positions in GLD. That makes sense given the intrinsic bullish bias in assets like equities and real estate, versus the defensive nature of gold.
Playing devil’s advocate, two points of caution regarding Stoken’s ACA (that are also applicable to a number of strategies that we track):
- Using US Treasuries as a “fallback” asset (as opposed to specifically choosing US Treasuries because they meet some criteria) might be less effective in the future given the implicit pressure on Treasury yields to rise (or at the very least, stop falling). That’s made worse by the fact that, unlike the 1970’s, rates are rising from a low base, so increases in yield have a greater impact on prices.
- Gold may lead to particularly unpredictable strategy returns when it makes up such a significant portion of strategy allocation. In this case, the strategy averages a 15% allocation to gold on any given day. Gold has historically gone through long multi-year trends, followed by long multi-year flat periods. This makes it ripe for momentum trading, but also means that expected returns over multi-year periods are especially unpredictable.
Extended Backtest:
Because this strategy relies on daily data, we were only able to extend the results above to 1988. These are the “official” results that you’ll find in our members section.
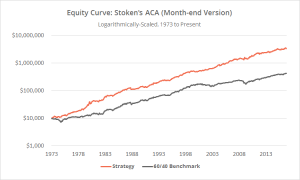
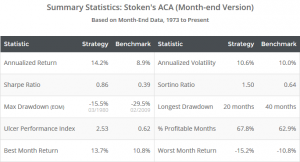
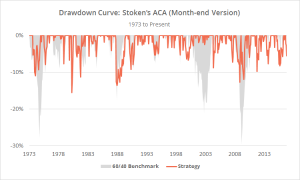
However, by slightly modifying the strategy rules and converting Stoken’s ACA to a month-end strategy, we’re able to extend results back to 1973, adding 15 years of data to our test. This allows us to judge performance during additional market regimes, like the 1987 market crash and rising rates in the 1970’s.
These month-end rules replace the strategy’s 252 and 126-day lookbacks with 12 and 6 month-end lookbacks. Trades are executed at the close on the final trading day of each month. All other strategy rules remain the same.
In the extended results below (click to zoom), we’ve married the original daily test with this new monthly test prior to 1988. Note that during overlapping years, the daily and monthly versions of the strategy performed similarly.
End notes:
Due to how infrequently this strategy trades, in both the daily and month-end backtests we assumed that SPY, GLD and VNQ were all long on day 1 of the test, as shown in Stoken’s results.
To stay true to Stoken’s test, we based the price channels on the cash price of SPY and the dividend-adjusted price of VNQ. That subtlety had little impact on results, but allowed us to exactly match his buy and sell dates.
Our test deviated from Stoken’s original as follows:
- We’ve assumed intermediate US Treasury trades were executed with IEF (7-10 year UST) as opposed to the similar (but slightly less volatile) 5-year UST, to better match the other strategies that we track.
- We’ve replaced Stoken’s n calendar day lookbacks with n trading day lookbacks to simplify calculations (ex. 252 day trading days in place of 365 calendar days).
- Stoken used a mix of month end and daily data for US real estate. For clarity, our “official” results use daily data only.
- Stoken’s original test assumed that the portfolio was rebalanced annually. We’ve assumed that the portfolio was rebalanced both annually and on any change in allocation to better match the other strategies that we track.
