This is a test of the tactical asset allocation strategy “Accelerating Dual Momentum” (ADM) from EngineeredPortfolio.com. ADM is an especially aggressive strategy that ties together multiple concepts from other TAA models that we track.
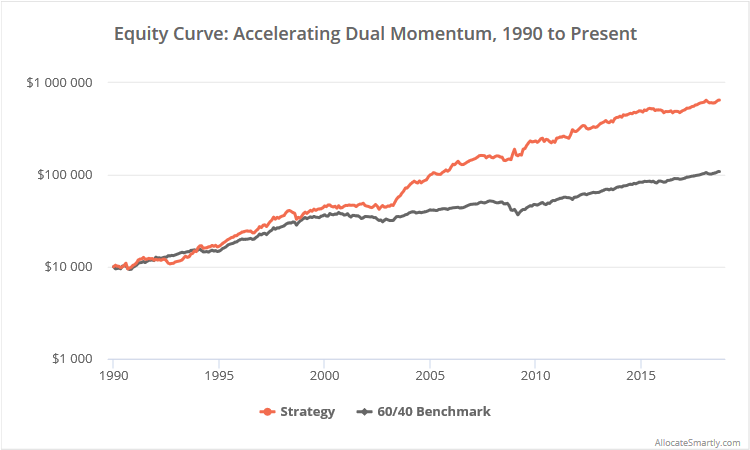
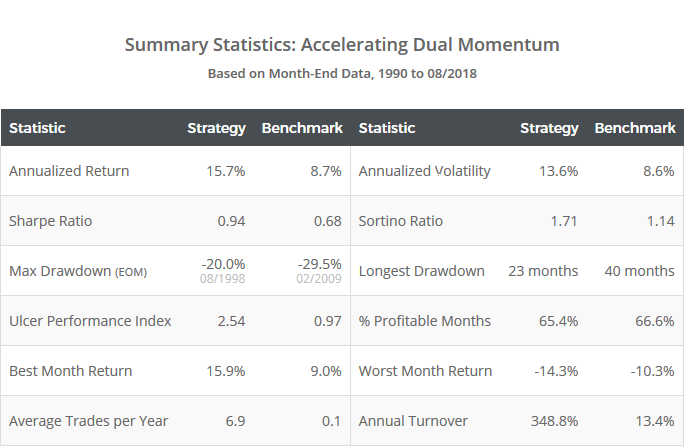
Results from 1990 to the present, net of transaction costs, follow. Read more about our backtests or let AllocateSmartly help you follow this strategy in near real-time.
Edit 05/2021: We extended the backtest presented here in a later post. Read more.

Logarithmically-scaled. Click for linearly-scaled chart.
ADM ties together multiple concepts from other TAA strategies that we track:
- It employs a “dual momentum” approach, first popularized by Gary Antonacci, by selecting assets that show strength on both an absolute and relative basis (i.e. relative to both itself and other assets).
- Unlike traditional dual momentum, the strategy measures momentum across multiple, shorter-term time frames, making ADM more responsive to market changes. This is a similar approach to Meb Faber’s Aggressive GTAA and Keller and Keuning’s Vigilant Asset Allocation.
By TAA standards, ADM is an extremely aggressive strategy, exhibiting the highest portfolio volatility of any strategy that we track (buyer beware).
Strategy rules tested:
This strategy allocates 100% of the portfolio to a single asset each month.
- At the close on the last trading day of the month, calculate a “momentum score” for two asset classes: the S&P 500 (represented by SPY) and international small cap equities (SCZ), by averaging each asset’s 1, 3 and 6-month total return.
- If the momentum score of SPY > SCZ and > 0, go long SPY at the close.
- If the momentum score of SCZ > SPY and > 0, go long SCZ at the close.
- If neither condition is true, go long either long-term US Treasuries (TLT) or US TIPS (TIP), whichever has the highest 1-month return.
- Hold position until the final trading day of the following month.
Note that the baseline strategy did not include the TLT/TIP rule (all trades were assumed to be placed in TLT). We included the optional TIP rule that the author mentions in the article based on the fact that (a) we’re pretty wary of long duration treasury exposure at this moment in history (read more), and (b) we wanted a bit more differentiation from other strategies that we track.
Faster, more responsive TAA:
 Traditionally, TAA strategies use longer-term measures of momentum. Some tried and true examples include Antonacci’s Dual Momentum (12-months), Faber’s GTAA (10-months) and Alpha Architect’s RAA (12-months). But we also track a number of strategies that take a shorter-term, more responsive approach, like ADM’s 1/3/6-month average.
Historically, both approaches have been effective on most asset classes (there are notable exceptions like Treasuries, but that’s a topic for another post). Deciding which is the better of the two is open to interpretation.
It’s important to note however, that all else being equal, more responsive strategies generate higher portfolio turnover, which increases transaction costs and short-term tax transactions. So if trading a more responsive strategy like ADM, it’s important that the juice is worth the squeeze post-transaction costs (which we’ve included here) and post-tax impact (which we model in our members area).
International small-cap equity as an asset class:
The author uses international small-caps (which we represent with SCZ) to fill the need for international equity exposure, as opposed to the usual solution, large-caps like EFA. In fact, this is the first strategy that we track to do so. There’s both an upside and downside to this approach.
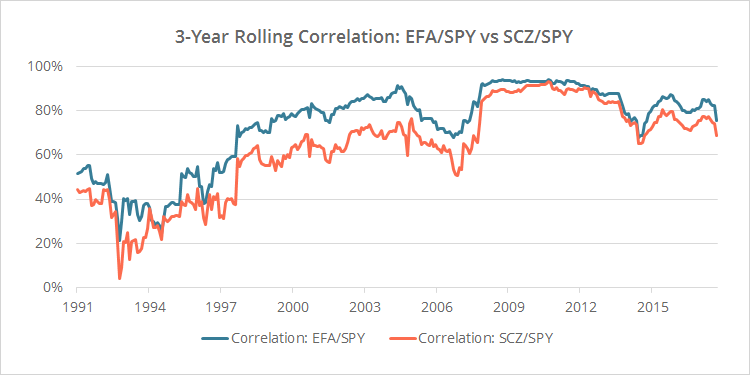
The upside is that international small-caps have exhibited lower correlation to the US market than large-caps. There hasn’t been a huge difference between the two, but that difference has been reasonably consistent. To illustrate, the graph below shows the rolling 3-year correlation between SPY/SCZ (orange) versus SPY/EFA (blue).
This strategy only holds one position at any given time, so there’s no diversification benefit of this lower correlation, but it might be important when we’re pairing the strategy with SPY with relative momentum. Further, international small cap index volatility has run in-line its large cap counterpart, meaning that in terms of volatility, we’re replacing apples with apples.
The downside of choosing this asset class is pretty significant.
TAA models, by their nature, tend to trade infrequently. That means that we need a lot of data to really judge the efficacy of a strategy, and understand how it has changed over time and through significant events (like the Global Financial Crisis of 2007/08).
We extend most of our tests back to the 1970’s, depending on the availability of accurate data for simulating asset class performance prior to ETF launch (read more). But accurate data for international small-cap equities doesn’t exist that far into the past. As a result, we were only able to extend this test to 1990. That matters.
So while we think that the idea of replacing international large-cap exposure with small might have merit, readers should understand the limitations on historical data that decision introduces, and temper expectations accordingly.
Lastly, because we know some readers will ask, no, we did not use the author’s actively-traded mutual fund data in our tests. You know why.
Red(ish) flag! Alternate trading day analysis:
The results presented above are relatively short, but obviously very good.
Readers know that we do something pretty nifty on our site for strategies like ADM that trade once per month: we show the results of trading on other days of the month as well. We’re not simply moving the date of execution forward. It’s a more complicated approach that maintains the “integrity” of the monthly data interval, but on other trading days (read more).
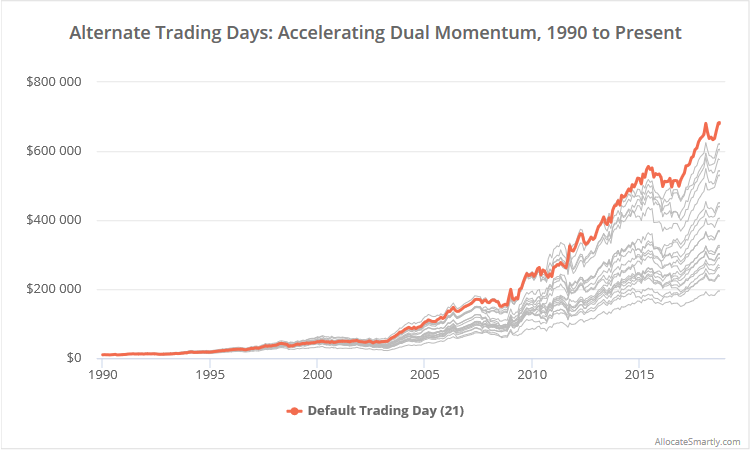
Below we show the results for ADM on these alternate trading days. Trading at the end of the month as the strategy was originally designed is shown in orange. Generally speaking, this isn’t what you want to see.

Linearly-scaled. Click for a logarithmically-scaled graph.
First, there’s a wide disparity in results. That’s not uncommon among strategies that hold concentrated positions using shorter-term indicators like ADM. The difference in performance trading on one day to the next can be drastic. Of course, members can mitigate that risk with portfolio tranching.
More important is the fact that there’s a wide disparity in results and the author’s original end-of-month variation happens to be the best of the bunch. Yes, trading on days near the beginning and end of the month tends to be good for TF/momentum strategies (read more), but the fact that EOM is an outlier suggests that these results may be somewhat over fit to history. Small changes in inputs (like choosing to trade one day earlier or later) shouldn’t have as dramatic of an impact on results as they do here.
That doesn’t mean the strategy doesn’t have value, only that these results may be a tad optimistic.
In summary:
There’s definitely a lot of good in ADM. The concepts included are a mix and match of other excellent TAA strategies that you’ll find here. The strategy is extremely aggressive by design, but members are able to manage some of that risk by using our platform to combine ADM with other more moderate strategies.
Given ADM’s strong showing amongst the strategies that we track, it has naturally received a lot of interest from members. We would suggest that members bear in mind however the issues discussed above, and temper expectations accordingly.
New here?
We invite you to become a member for about a $1 a day, or take our platform for a test drive with a free limited membership. Put the industry’s best tactical asset allocation strategies to the test, combine them into your own custom portfolio, and then track them in near real-time. Have questions? Learn more about what we do, check out our FAQs or contact us.


