This is a test of a tactical asset allocation strategy from the excellent paper: The Trend is Our Friend: Risk Parity, Momentum and Trend Following in Global Asset Allocation (1). The strategy combines two important tools: trend-following (to determine what assets to hold) and risk parity (to determine how much of each asset to hold), to produce one of the least volatile strategies that we track.
Here we’ve tested two versions of the strategy: the first focused on the US, and the second on global markets. Read more about our backtests or let AllocateSmartly help you follow this strategy in near real-time.
US Risk Parity Trend-Following
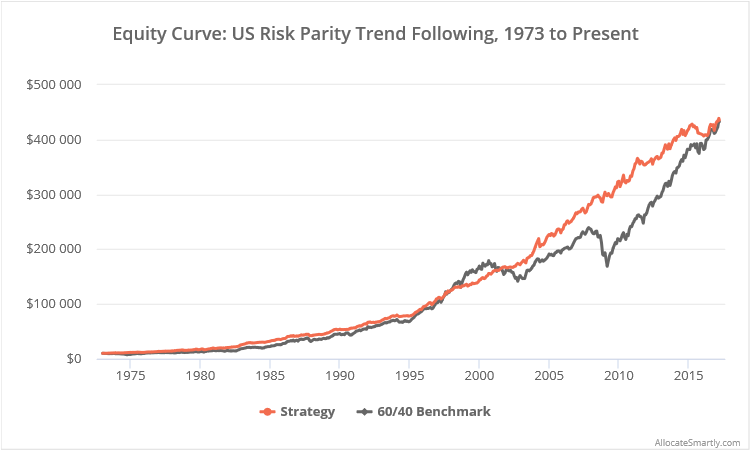
Results from 1973, net of transaction costs, follow:

Linearly-scaled. Click for logarithmically-scaled chart.
The source paper applied the strategy to a set of global asset classes. Here we’ve tested a variation of the strategy applied to the US market, allowing us to extend our test much further into the past. The five US asset classes traded are: large-cap equities (represented by SPY), small-cap equities (IWM), Treasuries (IEF), commodities (DBC) and real estate (VNQ).
Strategy rules tested:
- At the close on the last trading day of each month, determine portfolio weights based on simple 12-month risk parity as described by Cliff Asness, et al. in Leverage Aversion and Risk Parity. Assume that all assets are long. Risk parity means that less volatile assets (ex. treasuries) will be allocated a larger portion of the portfolio than more volatile assets (ex. equities).
- At the close, allocate to each asset that will close above its 10-month moving average (2), otherwise allocate that portion of the portfolio to cash.
- Hold positions until the final trading day of the following month. Rebalance the entire portfolio monthly, regardless of whether there is a change in position.
What the strategy does well:
- The strategy uses the same trend-following approach as Meb Faber’s classic GTAA strategy (i.e. comparing the close to the 10-month moving average) to determine which assets to hold each month. This is a simple, but tried and true approach to trend-following. Like many trend-following methods, it hasn’t been particularly effective generating outsized returns, but has been effective in managing losses.
-
The strategy uses simple risk parity to determine how much of each asset to hold. Because each asset’s portion of the portfolio is maintained even when that asset is in cash, the strategy ensures that the portfolio doesn’t become overly concentrated. In other words, the strategy enforces a certain degree of balance.
One downside of this approach is a large exposure to cash (30% on average) that some might see as wasted opportunity. Compare this to the more aggressive approach taken in GestaltU/ReSolve’s Adaptive Asset Allocation, where portfolio optimization is performed after selecting assets, ensuring the portfolio is always fully allocated. Another downside is that Treasuries will tend to have a relatively large position size, because they tend to be less volatile. That’s a potential concern in an extended period of rising interest rates.
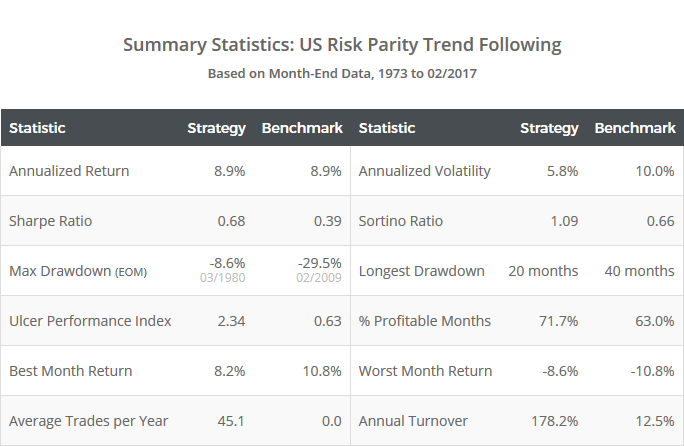
- The net effect of these two features can be seen in the summary stats above. Note the reduced drawdown (-8.6% vs -29.5% for the benchmark), improved UPI (2.34 vs 0.63), and extremely low volatility (5.8% vs 10.0%).
 I would prefer that the authors used more sophisticated Equal Risk Contribution (ERC) in place of simple risk parity. Here’s a nice post from CSS Analytics describing the difference between the two. In short, simple RP only considers variance when equalizing each asset’s risk contribution to the portfolio, while ERC takes into account covariance (i.e. both variance and correlation). This ensures that a similar asset being added to the portfolio (ex. SPY and IWM) is treated differently than a dissimilar asset (ex. SPY and IEF).
Finally, members be sure to check out the Alternate Trading Days report available in the members area. While some turn of the month effect appears likely with this strategy, it also appears that the results presented here may be a tad on the optimistic side (learn more).
Global Risk Parity Trend-Following
Next, we test the strategy applied to a set of global asset classes as described in the source paper. The biggest hurdle in this analysis is a lack of data. The source paper uses a number of asset classes that don’t have an equivalent large, liquid ETF available in today’s market, so we’ve tried our best to maintain the spirit of the strategy.
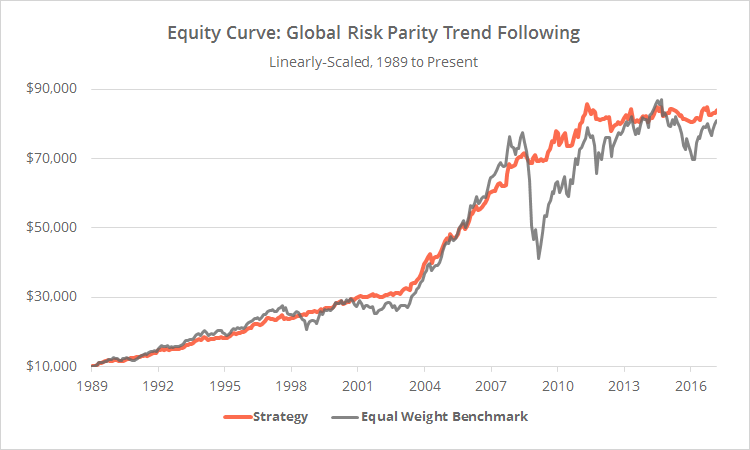
Results from 1989, net of transaction costs, follow:

Linearly-scaled. Click for logarithmically-scaled chart.
The strategy rules are the same as those described previously. The only difference in our global test is the assets traded (3): US equities (SPY), international equities (EFA), emerging markets (EEM), US Treasuries (IEF), international treasuries (BWX), commodities (DBC) and global real estate (RWO) (4). We’ve benchmarked the strategy to an equally-weighted benchmark. If attempting to replicate our results, be sure to check out the end notes as there are a number of bugaboos that we’ve glossed over for brevity.
Drawing the right conclusion:
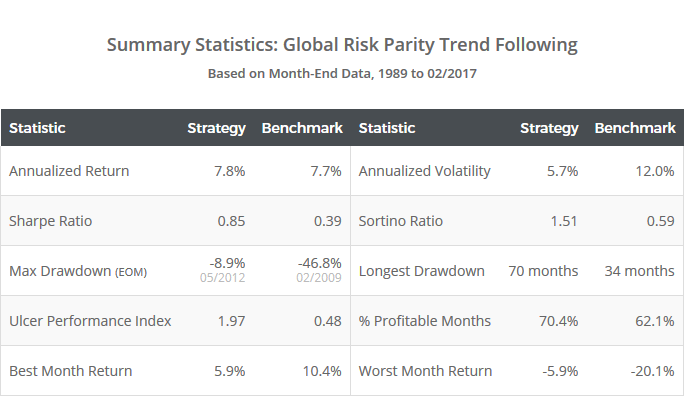
It would be easy to conclude from the poor results over the last 6 years that the global version of this strategy is inferior to the US version. I think that would be the wrong conclusion.
The global results highlight what we already know about this trend-following/risk parity combination: its primary benefit has been in managing losses, not in generating outsized returns. These global asset classes have been largely flat over the last 6 years (from the perspective of these currency hedged US-based ETFs), and the flat results for the strategy over the last 6 years is likely more a byproduct of that fact than an indication that the strategy is less successful trading global assets. I would be more or less equally confident in both the US and global variation of this strategy moving forward.
Summary
The tactical asset allocation strategy presented here combines trend-following with risk parity, and while it has struggled to produce outsized gains, it has done an excellent job historically managing losses and minimizing volatility. I look forward to analyzing more of the strategies presented in this paper.
We invite you to become a member for less than $1 a day, or take our platform for a test drive with a free limited membership. Members can track the industry’s best tactical asset allocation strategies in near real-time, and combine them into custom portfolios. Have questions? Learn more about what we do, check out our FAQs or contact us.
Calculation notes:
(1) The source paper includes a number of strategy variations. Here we’ve tested the broad asset class strategy described in section 3.1 of the paper.
(2) Like the source paper, we’ve assumed that the trend-following component of this strategy used the cash price (as opposed to the dividend-adjusted price) for SPY, IWM, VNQ, EFA, EEM and RWO, when deciding whether to allocate to a given asset.
(3) In the global test, the following assets are allocated half of their normal risk parity weight: SPY, EFA, IEF and BWX (in the parlance of Asness’ paper, sigma-hat is multiplied by 0.5). This is necessary because some asset classes don’t have a representative large, liquid ETF available. For example, an appropriate global treasury ETF doesn’t exist, so we’ve divided that allocation between US (IEF) and international (BWX) treasuries. Note that this half allocation applies to the equal weight benchmark as well.
(4) In the global test, prior to late 1993 we substituted US real estate data (VNQ) in place of global real estate data (RWO) due to a lack of accurate asset class data.


