This is a summary of the recent performance of a number of excellent tactical asset allocation strategies. These strategies are sourced from books, academic papers, and other publications. While we don’t (yet) include every published TAA model, these strategies are broadly representative of the TAA space. Read more about our backtests or let AllocateSmartly help you follow these strategies in near real-time.
Commentary:
 Tactical asset allocation turned in a mixed performance in March, with returns ranging from +1.21% (Robust Asset Allocation) to -1.98% (Flexible Asset Allocation). That gap in results was largely explained by each strategy’s exposure to two key asset classes that were particularly weak for the month: US Real Estate (VNQ, -2.4%) and Diversified Commodities (DBC, -3.2%). Top performing asset classes were all related to international equities, including Europe (VGK, +4.4%) and Emerging Markets (EEM, +3.7%).
As one would expect given the exposure that many of these strategies have to momentum, we saw a decrease (increase) in average allocation to those weak (strong) asset classes. The chart below shows the average allocation to broad categories of assets by the 33 strategies that we track, as of the end of each month for the last two years (for a longer view, see this post). For example, “US Equities” may include everything from the S&P 500 to individual stock market sectors.

My commentary on the state of TAA over the last few months has remained essentially the same: the strategies that we track remain bullish on risk, and are now bumping up against historical high levels of exposure to risk assets. That’s a good thing should this rally continue, but there is significant exposure to investors if the market stumbles in April.
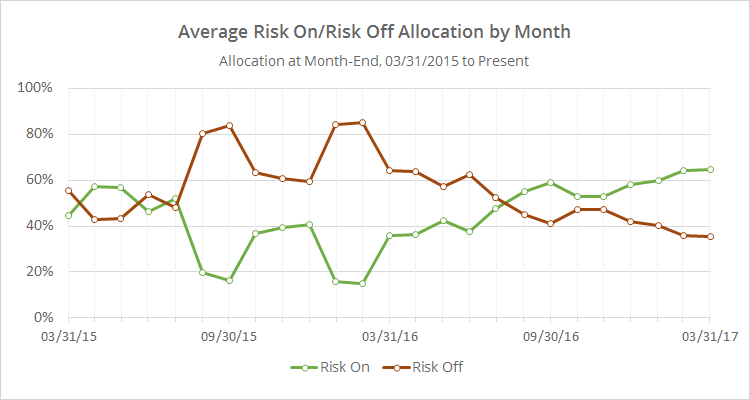
To make this point more clear, below I’ve combined the average TAA allocation into even broader categories: “risk on” (equities, real estate and high yield bonds) versus “risk off” (everything else). I realize that some asset classes don’t fit neatly into these buckets, but it makes for a useful high level view. Exposure to risk assets is now at a sample high, and looking even further into history, it’s at the highest point since mid-2007.
We invite you to become a member for less than $1 a day or take our platform for a test drive with a free limited membership. Track the industry’s best tactical asset allocation strategies in near real-time, and combine them into custom portfolios. Have questions? Learn more about what we do, check out our FAQs or contact us.