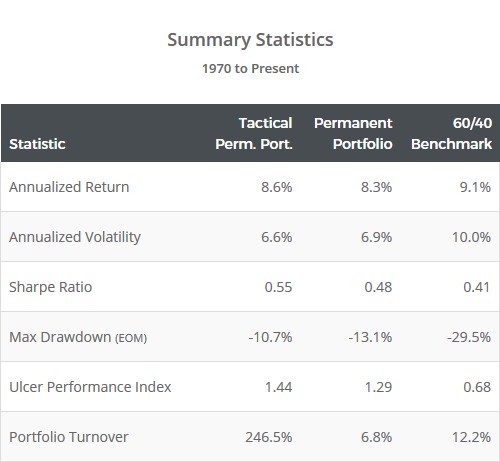
This is a test of the Tactical Permanent Portfolio from the brains at GestaltU and ReSolve Asset Management. The strategy adds a number of dynamic features to a classic buy & hold strategy to better manage volatility and losses. Results from 1970, net of transaction costs, follow.
Read more about our backtests or let AllocateSmartly help you follow this strategy in near real-time.
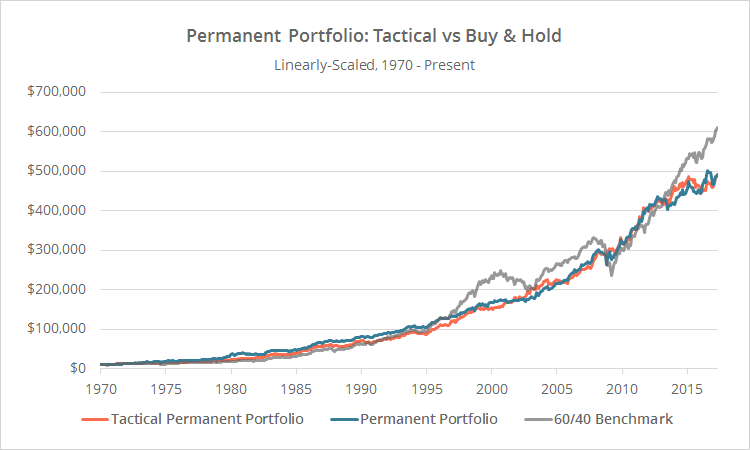
Linearly-scaled. Click for logarithmically-scaled chart.
It’s very easy (and foolish) to look at the data above and conclude that the 60/40 benchmark is superior simply because it ended the test with the highest terminal value. Experienced investors who have paid their dues in the trenches know that it’s month-to-month volatility and drawdowns that cause investors to abandon the best laid plans (usually at the worst possible moment). In the real world, there’s value in minimizing volatility and drawdown even without an expectation of an increase in return.
The original Permanent Portfolio, from Harry Browne and his book Fail-Safe Investing, attempts to do that using a “four seasons” approach to investing. The portfolio is split evenly between four assets, each designed to capitalize on one of four possible economic conditions: equities (SPY) during periods of prosperity, short-term US Treasury bills (represented here by cash) during recession, gold (GLD) during inflation and long-term US Treasury bills (IEF) during deflation (1). The historical effect of this approach can be seen in the 30%+ reduction in volatility, and improvement in both return relative to volatility (Sharpe Ratio) and return relative to drawdown (UPI), compared to the ubiquitous 60/40 benchmark.
Improving on the Permanent Portfolio
GestaltU’s Tactical Permanent Portfolio expands on Browne’s buy & hold strategy by adding three key features:
- Momentum: The strategy holds just those assets showing recent strength and ignores those assets showing recent weakness.
- Risk parity weighting: Less volatile assets are allocated a larger percentage of the portfolio, and vice-versa.
- Volatility targeting: The strategy attempts to maintain maximum portfolio volatility of 7% (roughly the long-term volatility of the buy & hold portfolio), by allocating more to cash during volatile periods.
Strategy rules tested:
Note that all calculations are lagged by one day, meaning that on the day prior to the last day of the month, we already know the trade that will be taken at the close on the last day of the month.
- At the close on the last trading day of the month, select those assets that ended yesterday above their 200-day moving average. The asset universe is SPY, IEF and GLD.
- For those assets selected, determine their initial asset allocation using simple 1/vol risk parity (as of yesterday’s close), based on the 21-day volatility of returns.
- For the resulting risk parity portfolio, calculate portfolio-level annualized volatility based on 60-day variance/covariance. If above 7%, scale down to 7% by adding cash. All trades are executed at the close. Note that GestaltU’s results assumed leverage was used when portfolio volatility was less than 7%. We have not done so here. See the end notes for more information.
- Hold positions until the final trading day of the following month. Rebalance the entire portfolio monthly, regardless of whether there is a change in position.
Effect on allocation:
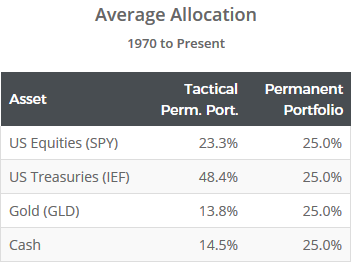
The combined effect of the above rules can be seen in the table to the right showing the average allocation to each asset for both the buy & hold and tactical versions of the Permanent Portfolio.
Note the significant increase in allocation to US Treasuries as a result of the use of risk parity weighting (Treasuries tend to be less volatile than equities or gold, hence the larger allocation). Also note the allocation to cash, which is mostly due to attempts to maintain portfolio volatility under 7%.
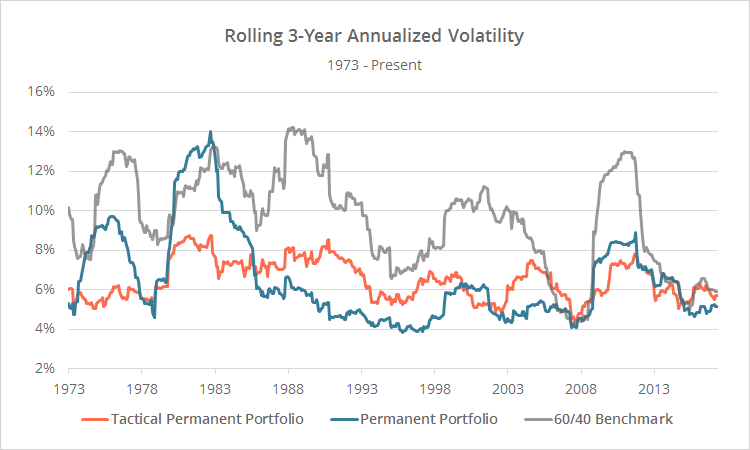
This has resulted in a more consistent risk profile than either the original Permanent Portfolio or the 60/40 benchmark. To illustrate, the graph below shows the rolling 36-month annualized volatility of all three strategies.
Of course, the increased reliance on US Treasuries raises its own concerns about how the strategy would perform in an extended period of rising interest rates (as we’ve written about here and here), but at least the strategy has a mechanism to rotate out of Treasuries when they’re underperforming.
Trading TLT (long-term US Treasuries) versus IEF (int-term US Treasuries)
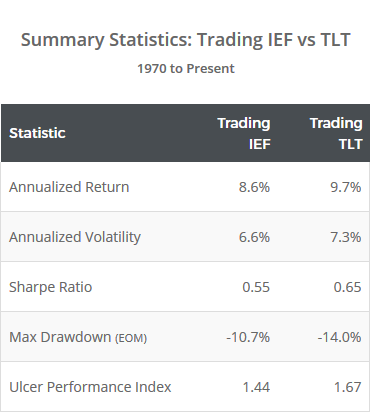
Interestingly, had we allowed for leverage (2), the combination of risk parity and volatility targeting employed by this strategy means that there shouldn’t be a significant difference in performance trading a more volatile instrument like TLT (long-term US Treasuries) in place of IEF (intermediate-term US Treasuries); TLT would simply be allocated a smaller percentage of the portfolio.
But because we haven’t allowed for leverage, the strategy is often unable to get up to GestaltU’s intended 7% annualized volatility target. In the graph below we test an alternate version of the strategy trading TLT in place of IEF. This is, in essence, closer to GestaltU’s intended performance:
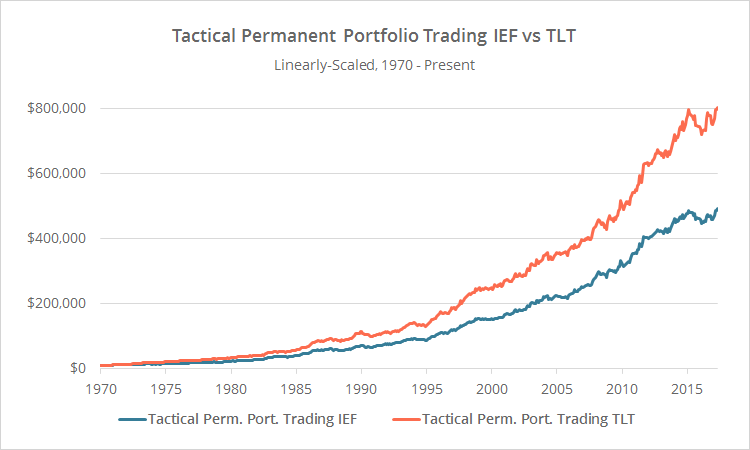
Linearly-scaled. Click for logarithmically-scaled chart.
Playing devil’s advocate, most of the outperformance of the TLT variation of the strategy came prior to about 1975 (the logarithmic chart makes this more clear), but I think this TLT variation of the strategy has value as it better demonstrates GestaltU’s intention sans leverage.
Note that, despite our frequent warnings about the risk of TLT in an era of rising interest rates, in this specific case the way in which the strategy determines allocation (risk parity + volatility targeting), ensures that replacing IEF with TLT doesn’t significantly increase risk.
Thank you to GestaltU and ReSolve for all of their fine work and for the opportunity to put this model to the test. These guys bring a level of rigor to the subject of tactical asset allocation that very few can match, and I highly recommend following them now.
The brains behind GestaltU/ReSolve have been working with us on the best approach to sussing out an important problem: universe overfitting. Strategy developers sometimes choose investment universes (i.e. the assets that a strategy can choose from) based purely on how they’ve performed in the past, making historical results overly optimistic and future out-of-sample results likely to disappoint. Expect an ad hoc analysis shortly on this blog, and in the long-term, a permanent feature to be added to our members section devoted to the subject.
We invite you to become a member for less than $1 a day, or take our platform for a test drive with a free limited membership. Members can track the industry’s best tactical asset allocation strategies in near real-time, and combine them into custom portfolios. Have questions? Learn more about what we do, check out our FAQs or contact us.
End notes:
(1) The version of the buy & hold Permanent Portfolio that we track in our members section trades TLT (20-30 year UST) in place of IEF (7-10 year UST), as this better matches Browne’s original design. We’ve opted to show the strategy trading IEF here to better match GestaltU’s tactical model.
(2) GestaltU’s results assumed that leverage was used when annualized portfolio volatility was expected to be less than 7%. As a rule of thumb we do not show the results of leveraged trading on our site. From a technical perspective our site is built to support leverage, and we don’t think that there’s anything inherently wrong with employing leverage, but we worry that less experienced investors do not fully appreciate the risks involved and so have opted to keep this site leverage free.
