New to Tactical Asset Allocation? Learn more: What is TAA?
In our previous post, we looked at the tax impact of TAA for investors trading in taxable accounts. Using our database of more than 40 published TAA models we concluded that, while TAA as a whole has been relatively tax efficient, the particular strategies that you choose matters…a lot. Individual strategies range from very to not remotely tax efficient.
In this post, we want to look at a set of four strategies that have been both very active and particularly tax efficient. Despite trading often, with portfolio turnover in the 120-150% per year range, they have all successfully shifted capital losses to short-term trades (<= 1 year) and capital gains to tax-advantageous long-term trades (> 1 year).
We’re referring to Meb Faber’s “Global Tactical Asset Allocation” from the seminal paper A Quantitative Approach to TAA, and Alpha Architect’s “Robust Asset Allocation” from the book DIY Financial Advisor. We track two versions of each of these strategies, but in this post we’re going to focus on the simplest of them: Meb Faber’s GTAA 5. Results for the other three would have been similar to those presented here.
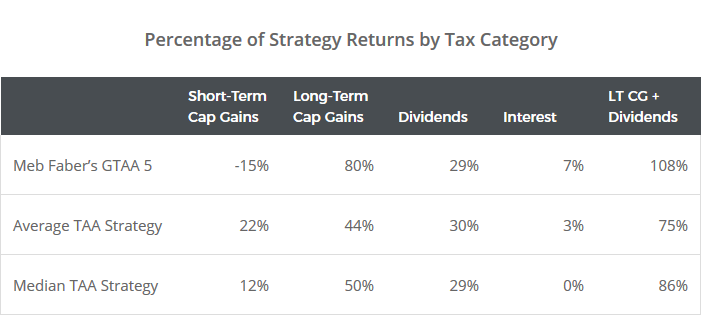
First, let’s look at the percentage of GTAA 5’s historical gains attributed to broad tax categories. Our test extends from 1973 to the present, and assumes all trades were closed out at the end of the test to capture any unrealized gains.
The key takeaways: The majority of GTAA 5’s historical gains have come from tax-advantageous long-term capital gains and dividends. Short-term trades were net losers. There was a larger than usual interest component (return on cash) which, depending on the specific asset traded, could also qualify as dividends.
What has made Faber’s GTAA so tax efficient?
 There are three key strategy features that these tax-efficient strategies share:
- Fixed position sizes that are independent of other assets in the portfolio
- No use of cross-sectional (aka relative) momentum
- Long-term measures of momentum/trend
GTAA 5 divides the portfolio into equal slices of 20% each among five asset classes: US equities, international equities, US Treasuries, commodities and real estate. The strategy trades once per month using a simple trend-following rule: hold those assets that will close above their 10-month moving average, otherwise move that portion of the portfolio to cash. We assume that all assets are rebalanced monthly, regardless of whether there is a change in allocation.
Key feature #1: Note how position sizes are fixed, regardless of what the other assets in the portfolio are doing. There may be a bit of buying and selling each month as a result of the monthly rebalance, but the core position survives as long as the asset maintains a positive trend. That encourages the bulk of positions to qualify as long-term.
Key feature #2: Note too how the strategy doesn’t use cross-sectional (aka “relative”) momentum. Strategies that use cross-sectional momentum measure the performance of each asset relative to other assets in the portfolio to make buy/sell decisions. That means that they sometimes switch from one asset for another that’s only marginally better. It’s one thing to close out a position because an asset has turned sour. That’s worth generating a taxable event. It’s another thing to close a position that is still good, it just might not be quite as good as some alternative. That might not be worth generating a taxable event.
This lack of cross-sectional momentum likely hurts pre-tax returns, because in a tax-free (and transaction cost free) world, a marginally better position is always a better position. But in a taxable account, ignoring cross-sectional momentum may result in superior after-tax returns.
Key feature #3: Lastly, all four strategies trade based on long-term measures of momentum and trend. For GTAA that’s price relative to a 10-month moving average. RAA uses an even longer measure. These types of indicators, by their nature, tend to push losses to the short-term and gains to the long-term. Trades that end quickly are often losers. The strategy takes a position in an asset showing strength, it turns weak, and the strategy exits. Trades that continue for a long period of time tend to be winners. The strategy takes a position and the asset continues showing strength. Even when the asset eventually turns weak, the strategy has already profited enough that the trade is a net gain.
Breaking down the trades
There were a lot of trades in our test of GTAA 5 (1,937 to be exact), but the vast majority were “insignificant”. By insignificant, we’re referring to all of those little trades that are occurring each month to rebalance the portfolio back to even 20% slices. These insignificant trades are included in the results above. They’re important as a whole to maintain diversification, but individually they don’t move the total needle as much due to their size.
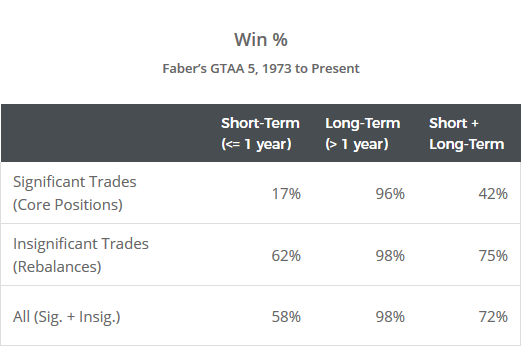
Below we’ve broken down the % of both significant and insignificant trades that were winners based on whether the trade qualified as short or long-term.
Key takeaways:
- The overwhelming majority of significant long-term trades were winners (96%) and significant short-term trades were losers (17%). That’s in-line with our earlier points about long-term momentum/trend pushing gains to the long-term and losses to the short-term.
- Insignificant long-term trades were also overwhelmingly winners (98%). We’re assuming sales are FIFO, so any rebalance sales that occurred on a long-term position were also more likely to be winners for the same reason.
- Breaking the pattern were insignificant short-term trades, which tended to also be winners (62%). That makes sense though. The strategy takes a position in an asset. It quickly increases in value and the strategy has to sell a portion of the position to rebalance back to 20%. Had the asset instead quickly decreased in value, the strategy would have been more likely to close out the position altogether.
Putting together all the pieces, below we’ve shown the % of capital gains that came from trades that were significant vs insignificant and short vs long-term.
That’s a lot of data to digest, but it fits the narrative. The strategy makes the bulk of its gains from long-term trades, be they significant (selling an entire core position) or insignificant (selling a portion of the position in a rebalance). Short-term trades are net losers, with those losses really coming from significant short-term trades, when the strategy realizes quickly (<= 1 year) that it made a bad decision and exits.
Conclusions
As we discussed in our previous post, individual TAA strategies have ranged from very tax efficient to not remotely so. Members can see this data broken down per strategy in our members area.
In this post, we looked at a set of strategies that have been particularly tax efficient despite trading often, and the three key strategy features that make them so:
- Fixed position sizes that are independent of other assets in the portfolio
- No use of cross-sectional (aka relative) momentum
- Long-term measures of momentum/trend
Using Meb Faber’s classic GTAA 5 as our example, we showed that these strategies successfully push capital losses to the short-term (<= 1 year) by closing out losing trades quickly, and push capital gains to the more tax-advantageous long-term (> 1 year) by encouraging winners to run, without consideration for other assets in the portfolio.
We invite you to become a member for about a $1 a day, or take our platform for a test drive with a free limited membership. Put the industry’s best tactical asset allocation strategies to the test, combine them into your own custom portfolio, and then track them in near real-time. Have questions? Learn more about what we do, check out our FAQs or contact us.
Calculation notes: We covered a full list of “calculation notes” in our previous post that interested readers should refer to. Importantly, note that we’ve simplified these results to a large degree, and there’s some nuance that we haven’t taken into consideration. In some cases, that nuance could make these results worse, such as the impact of wash sales, qualified versus ordinary dividends, etc. In others, it could make these results better, such as intentionally executing a sale a bit early or late in order to qualify as a short or long-term cap loss/gain. Most importantly, note that we are not accountants and this is not tax advice. Consult your tax professional for guidance on the most appropriate investments for your unique financial situation. You, and you alone, are solely responsible for any investment decisions that you make.


