This is a test of the “TrendYCMacro” strategy from the paper Avoid Equity Bear Markets with a Market Timing Strategy from Ďurian and Vojtko of Quantpedia. The strategy combines trends in price, the slope of the yield curve and key economic indicators to switch between US equities and cash.
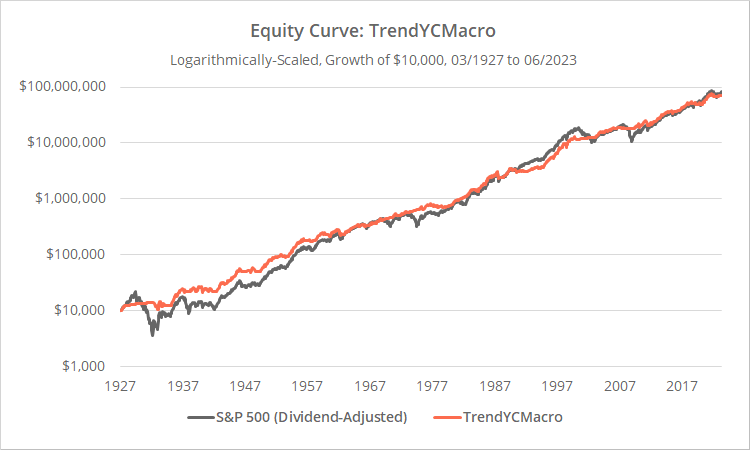
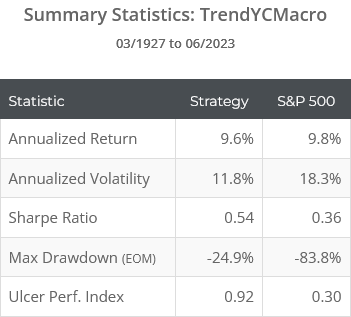
Backtested results from 1927 follow. Results are net of transaction costs – see backtest assumptions. Learn about what we do and follow 70+ asset allocation strategies like this one in near real-time.

Logarithmically-scaled. Click for linearly-scaled chart.
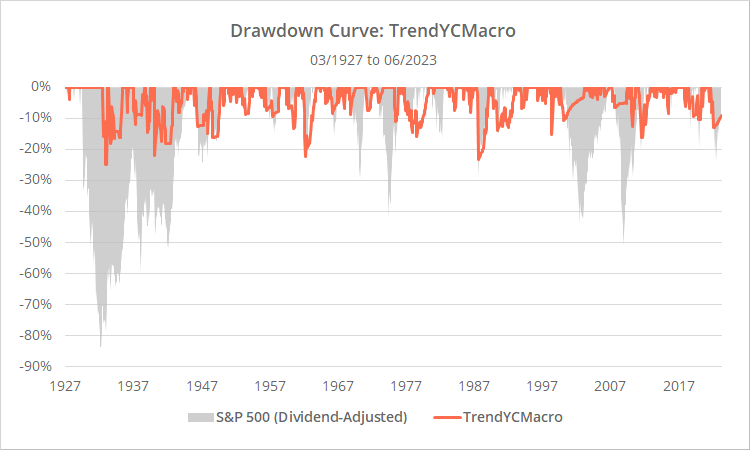
The benefit of a strategy like this isn’t clear from the 30,000 foot view above. It’s when we drill down on those results we see that, like many trend-following strategies, the strength of TrendYCMacro has been in managing losses and excessive volatility. In the real world that matters; major losses cause investors to abandon their best laid plans, usually at the worst possible moment by selling low.
Overview:
TrendYCMacro is similar to Philosophical Economics’ Growth-Trend Timing.
The basic premise of these strategies is that traditional trend-following based on asset prices alone does a good job determining when to switch to defensive assets during periods of economic weakness, but a poor job during periods of economic strength.
When economic indicators are indicating that the economy is strong, it’s a sign that we should turn trend-following off and just ride the general positive sentiment.
Strategy rules tested:
1. At the close on the last trading day of the month, calculate the year over year change in three economic indicators as of the end of the previous month (to account for delays in reporting) (*):
- Real Retail and Food Service Sales (RRSFS, a measure of economic consumption)
- Industrial Production Index (INDPRO, a measure of economic production)
- Housing Starts (HOUST, a leading indicator of economic activity)
If the YOY change in all 3 indicators is positive, and the strategy is already currently long, that’s enough to satisfy our criteria for “economic strength”. Go long SPY (S&P 500) at the close.
Put another way, economic strength is enough to maintain a long position, but not enough alone to initiate a new position.
2. If the conditions above are not satisfied, defer to trend-following and the yield curve. Here the authors use three measures, two of trend and one of the slope of the yield curve. If all three conditions are met, go long SPY (S&P 500) at the close.
- Trend: Current price of stocks (SPY) greater than the 200-day average.
-
Trend: 200-day Rachev Ratio of stocks (SPY) greater than 1.The Rachev Ratio in this context is simply the average daily % return of stocks over the last 200 days that exceeded the median 200-day % return, divided by the average daily % return of stocks over the last 200 days that fell below the median 200-day % return, multiplied by -1.
-
Yield curve: 10-year US Treasury yield is greater than the 3-month US Treasury yieldAn inverted yield curve (i.e. 10Y < 3M) is uncommon, only occurring in about 10% of months, and is viewed as a leading indicator of recessions and market downturns.
An important note: The two trend-following measures above are based on the daily return of stocks (SPY) in excess of the risk-free rate (BIL).
3. If either (a) all three economic conditions are met and the strategy is currently long, or (b) all trend-following/yield curve conditions are met, go long stocks (SPY) at the close, otherwise move to cash.
All positions are held until the last trading day of the following month.
Discrepancies between our test and the authors’ original:
The authors were kind enough to provide the exact calculations they used to produce their study (hoorah), so we’re able to identify precisely any discrepancies in our results. Our backtested results are more pessimistic than those presented by the authors by about 40 bps per year over this test.
There are three reasons for that:
- We include a transaction fee assumption of 0.1% per trade (0.2% round-trip), and apply an expense ratio to the (pre-ETF) return on stocks equal to the current expense ratio of SPY.
- We use vintaged economic data, when possible, to more accurately reflect the data that would be available to the investor at that moment in time before subsequent data revisions.
- The authors use data from Professor French to represent market and risk-free returns. While we think that data has value in the right context, we use alternative data sources.
Our take on TrendYCMacro:
The good…
Broadly speaking, we are proponents of this idea of marrying economic data analysis with trend-following. It can be difficult for trend-following to add value when the market is in a long, grinding bull market. Trend-following really only comes into its own during periods of market stress.
Further, if trading in a taxable account, these types of strategies tend to be very tax efficient because they’re not reacting to every zig and zag of the market.
Based on our own analysis, approximately 81% of TrendYcMacro’s profits would have been categorized as long-term capital gains (based on current US tax laws) and between 15% and 25% would have been categorized as dividends (depending on how “cash” is represented). Short-term positions in stocks would have actually been a net cap gains loss.
The (potentially) bad…
Our only negative critique is essentially the same thing we wrote about a completely unrelated strategy: Bold Asset Allocation.
TrendYCMacro is taking a simpler concept (Growth-Trend Timing) and then narrowing the time in market based on other related-ish observations (i.e. HOUST, Rachev Ratio and yield curve).
Here’s the rub: the more we “stack” historically successful observations on top of each other, the more we increase the likelihood of overfitting to the historical data. We’re building stricter and stricter definitions of when to be in or out of the market.
That’s very different than say what we do with Model Portfolios. In that case, we’re splitting our allocation among things that have worked historically. The complexity of the individual observations is unchanged, we’re just spreading our bets across more of them.
Is that a death knell for TrendYCMacro? Not at all. We think all of the individual observations that the strategy is considering have value on their own. It’s simply a conceptual critique of this style of strategy design.
The cautionary…
TrendYCMacro is similar to other strategies we track beyond just Growth-Trend Timing. A total of 5 strategies we track make use of the same RRSFS and/or INDPRO economic data points.
We’re not saying anything negative about the predictive power of those data points. What we are saying is that we would be wary of accidentally taking too much exposure to this one concept by allocating too much to this “family” of strategies. Economic data can sometimes have difficulty correctly calling the market, because major downturns tend to be so fundamentally different.
For example, the 2000-02 and 2007-08 bear markets couldn’t be more different when viewed in terms of economic data, but were very similar and easily avoided in terms of trend-following.
In summary…
As a concept, we are proponents of TrendYCMacro and similar strategies. We leave it to members to judge it relative to other strategies from this family, as we generally avoid saying this strategy is better or worse than that one (the Cluster Analysis is a good place to get your bearings).
Unique additions from TrendYCMacro that other developers may consider investigating further are (a) the use of Housing Starts data (HOUST), and (b) the Rachev Ratio as a trend-following indicator.
A big thank you to Ďurian and Vojtko of Quantpedia for authoring this paper. Again, they were very helpful in helping us to replicate their approach precisely. They provided a level of transparency and willingness to expose their results to sunlight that we don’t always receive.
New here?
We invite you to become a member for about a $1 a day, or take our platform for a test drive with a free membership. Put the industry’s best Tactical Asset Allocation strategies to the test, combine them into your own custom portfolio, and follow them in real-time. Learn more about what we do.
(*) Geek note: Two of the economic data series mentioned (RRSFS and HOUST) do not extend over the entire life of the test. In those cases, the authors use other FRED data series with varying degrees of similarity. The precise breakdown is available from the authors by request.


