We’re in a unique position to analyze the behavior of Tactical Asset Allocation (TAA) investors. We track 90+ TAA strategies. Members combine these strategies into what we call “Model Portfolios”.
By analyzing how members form these Model Portfolios, we can understand the choices that TAA investors make when strategies are presented objectively (no marketing mumbo jumbo) and technical limitations are not an issue. Specifically, we want to answer two questions: (1) what strategies do investors choose, and (2) how do investors diversify their portfolios?
Rest assured, we are looking at aggregate numbers covering thousands of members, so it’s impossible to suss out any single member’s behavior.
What TAA strategies do members choose?
Here are the top 10 TAA strategies ranked by the average allocation within members’ Model Portfolios. When multiple versions of a strategy exist, we’ve combined them into a single entry.
 The top 4 strategies account for 51% of member allocation. The top 10 account for 67%. The pie chart to the right demonstrates how skewed the allocation is.
We presented similar stats 7 years ago, and member allocation is nearly as concentrated today as it was then. That isn’t inherently a bad thing – the strategies at the top of the list are all highly ranked across many performance metrics – but it is surprising given how much we’ve expanded the platform since then.
Two bits of specific feedback:
- Bold Asset Allocation: As we wrote in our analysis of BAA, we have concerns about historical overfitting. We’re not discouraging members entirely from trading BAA, but we would warn against over-allocating to the strategy.
- Accelerating Dual Momentum and Novell’s SPY-COMP: We encourage members to consider the “dynamic bond” version of both strategies rather than the original. It’s the same strategy with an additional safety valve in case of an extended period of rising interest rates.
Side note: The irony of the fact that we only track 4 proprietary strategies, where we know the rules but they are not disclosed to members, and 3 of those are in the top 10, is not lost on us.
How important is diversifying across strategies?
As mentioned, our platform allows members to combine multiple strategies together into what we call Model Portfolios. This provides a degree of not just asset diversification, but “process” diversification, as each strategy takes a different approach to trading.
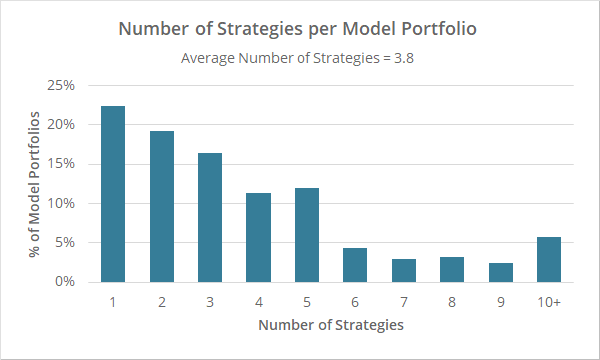
The graph below shows the number of strategies that members include in their Model Portfolios (note: buy & hold assets and portfolio tranching have been ignored):
Members have clearly embraced strategy diversification. 78% of Model Portfolios include multiple strategies. That increases to 81% if we account for single strategy portfolios where that single strategy is a Meta Strategy.
The average number of strategies per Model Portfolio is 3.8.
We’re pleased with that. If we have accomplished nothing else, we’ve at least helped move investors away from going “all in” on the latest fad strategy, and towards a more diversified approach.
Side note: Why would a member only include one strategy in their Model Portfolio? Possible reasons: (a) to receive email notifications, (b) to tranche a monthly strategy across multiple days of the month, or (c) because it’s a Meta Strategy, so it already includes multiple underlying strategies.
How important is diversifying across trading days?
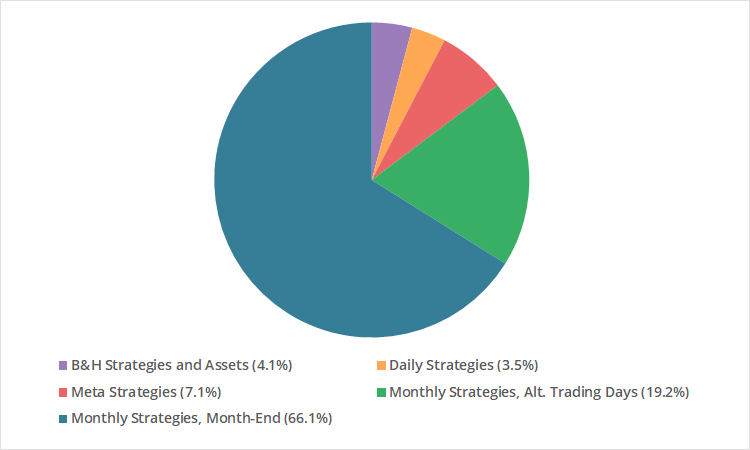
The graph below shows broad categories of strategies in members’ Model Portfolios. It shows that the majority of members’ allocation is to monthly strategies (85%), and most of that monthly strategy allocation is traded at month-end.
Monthly strategies are usually designed to trade on the last trading day of the month. A unique feature of our platform is the ability to follow these strategies on any other day of the month or even spread execution across multiple days (aka “portfolio tranching”). Learn more.
Members are generally not taking advantage of this capability.
We have mixed feelings about that. Our position is that…
- Over the very long-term, assuming a reasonably diversified portfolio, going all in at month-end will probably perform similarly to tranching across multiple days.
- There’s no data to suggest that over the long term any particular day of the month is better to execute trades than month-end.
- But if investors are willing to up the hassle factor just a bit and spread changes to the portfolio across multiple days of the month, it (a) helps to smooth out any short-term month-end underperformance, and (b) buys insurance if month-end does underperform over the long-term due to evolving markets.
On Meta Strategies…
For members who don’t want the complication of handcrafting their own combination of strategies, Meta Strategies are a simple all-in-one solution. They are a combination of up to 10 individual strategies, optimized to achieve an investment objective. Learn more and more.
We greatly expanded the selection of Meta Strategies a few months ago. Metas currently make up 7.1% of member allocation. It will be interesting to see if that grows over time.
Other random stats:
- Average number of strategies per Model Portfolio: 3.8
- Average number of Model Portfolios per member: 3.3
-
% of Model Portfolios with B&H assets (excl. cash and B&H strategies): 1.7%Members clamored for the ability to include B&H assets in their portfolios when we added this feature years ago, but after seeing the results, they’ve rarely opted to include them.
Nerd stuff: How we created these results
- We only considered “active members”, defined as members with an active membership who logged in to the platform within the last 3 months. That might seem like a long time, but many users set up their portfolios and then follow them via email notifications.
- We did not weight these results by the portfolio’s USD account size. All portfolios were considered equally.
- Pro members have up to 15 Model Portfolios, while non-Pro members have 3. That means Pro members have an outsized influence on these results. We tested limiting these results to just Pro members’ first 3 portfolios, but it didn’t have a significant impact.
- For the list of 10 most popular strategies, we split allocation to Metas among the underlying strategies. For example: if a user allocated 10% to a Meta and 10% of the Meta was allocated to Strategy X, we would count that as a 1% allocation to Strategy X (10% * 10% = 1%).
- An obvious limitation: We have no way of knowing the “significance” of a given portfolio. Portfolio X could be something a member is trading live, while portfolio Y could be reserved for just testing out new ideas. We have no way of knowing that level of detail.
In short:
- Strategy selection: Concentrated among a relatively small number of strategies.
- Diversification across strategies: Very good, widely employed.
- Diversification across trading days: Not widely employed, but likely not as important as strategy diversification.
New here?
We invite you to become a member for about a $1 a day, or take our platform for a test drive with a free membership. Put the industry’s best Tactical Asset Allocation strategies to the test, combine them into your own custom portfolio, and follow them in real-time. Learn more about what we do.


