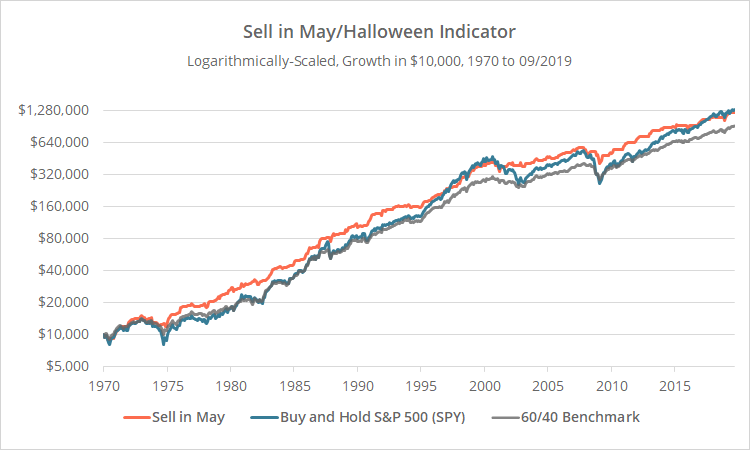
As a site that tracks all things asset allocation, it seems like a miss not to include the most well known of asset allocation strategies: “Sell in May and go away” (aka the Halloween Indicator). This is a fitting time to add it to the lineup: The strategy is killing it this year and a change in allocation is upon us.
The Sell in May strategy advocates holding stocks during the “wintery” 6-months from November to April and divesting during the “summery” 6-months from May to October. Sell in May has produced equity-like returns, with volatility and drawdowns in line with a more diversified portfolio.
Results from 1970 net of transaction costs follow (orange). We’ve compared performance to both the S&P 500 (blue) and the 60/40 benchmark (grey). Read about our backtests or let Allocate Smartly help you follow 50+ asset allocation strategies in near real-time.

Logarithmically-scaled. Click for linearly-scaled chart.
There are different interpretations of Sell in May that vary on the specific days traded. All of them are going to produce long-term results similar to what we’ve shown here. We’ve stuck with a simple end-of-month approach: Go long the S&P 500 (SPY) at the close on the last trading day of October. Move to cash at the close on the last trading day of April.
Our Take on Sell in May:
 A lot has been written both for and against Sell in May. We don’t want to go down the path of trying to wrangle all of that research here. Everyone (and we do mean everyone) has written on the subject, and it would take a week to curate it all fairly. If you’re interested in learning more, we would encourage you to do your due diligence.
As mentioned, Sell in May is absolutely killing it in 2019, with a year-to-date return of 19%+. The strategy perfectly timed both the market run up early in the year, and the subsequent lull mid-year. Having said that, Sell in May was one of the worst performing strategies that we track in 2018.
Is there value in Sell in May relative to a 100% buy & hold allocation to stocks? Probably. There’s a long history of outperformance, across many global markets (much like trend-following/momentum, but not as long or as strong).
Is there value in Sell in May relative to a smart tactical strategy that’s responding to actual market movement? In the long-term, almost certainly not. Four reasons:
- Most importantly, the historical performance of Sell in May has been inferior to even the simplest tactical approach that we track.
- Couple that with how infrequently it trades (just twice per year). That makes it difficult to know if/when the strategy has ceased to work. It would take more than a decade to say with any certainty whether out/under-performance was statistically significant.
- By design, Sell in May is very tax inefficient. In fact, it’s the least tax efficient of any strategy that we track (stats available to members here). That may or may not be relevant to you depending on your situation.
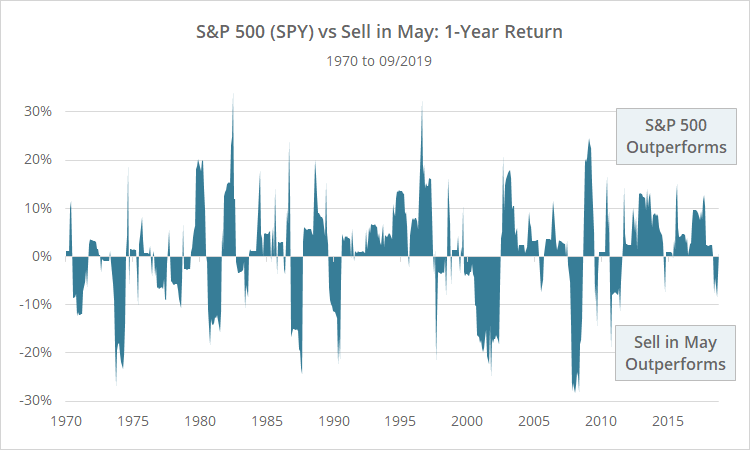
- Tracking error can be egregious. See below.
Sell in May is a real “hero or zero” approach. In years when it works well (like 2019) it can work very well. In years when it works poorly (like 2018) it can be a real dog. To illustrate, below we’ve shown the rolling 12-month return of Sell in May versus buying and holding the S&P 500 all year round. Note the frequency with which Sell in May has out/underperformed in excess of 20%.
It’s easy to look at long-term performance from 30,000 feet and say, “yeah, I could trade that”. But experienced investors know that it’s an entirely different thing to trade a strategy month in and month out. Short-term underperformance (i.e. the bad half of tracking error) must be held to tolerable levels because it leads investors to change their best laid investment plans, usually at the worst possible moment.
Could we see using Sell in May to bias the equity position as part of a more complete, robust asset allocation strategy? It has potential (sort of like the end-of-month Treasury seasonality we talked about last week). But as a standalone trading strategy? Probably not the wisest approach.
New here?
We invite you to become a member for about a $1 a day, or take our platform for a test drive with a free limited membership. Put the industry’s best tactical asset allocation strategies to the test, combine them into your own custom portfolio, and then track them in near real-time. Have questions? Learn more about what we do, check out our FAQs or contact us.

