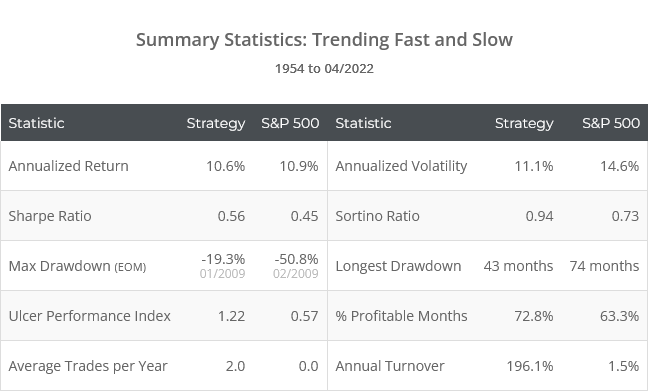
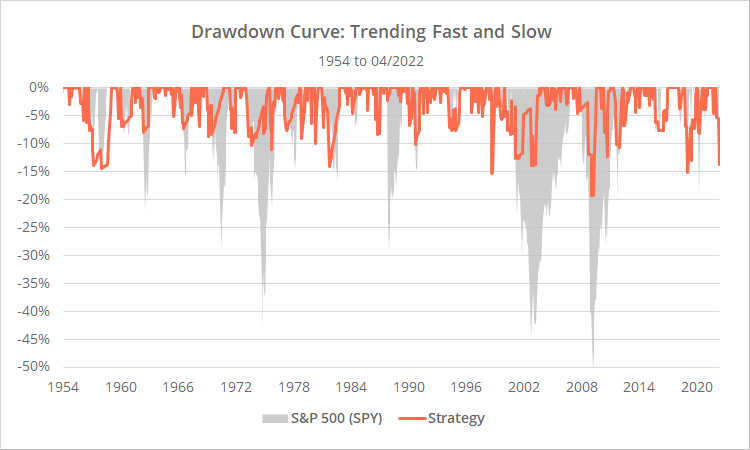
This is a test of a tactical strategy from the paper Trending Fast and Slow. It trades the S&P 500 by switching between fast and slow momentum based on market volatility. The strategy would have kept pace with the S&P 500, while significantly reducing the worst drawdowns.
Backtested results from 1954 follow. Results are net of transaction costs – see backtest assumptions. Learn about what we do and follow 60+ asset allocation strategies like this one in near real-time.
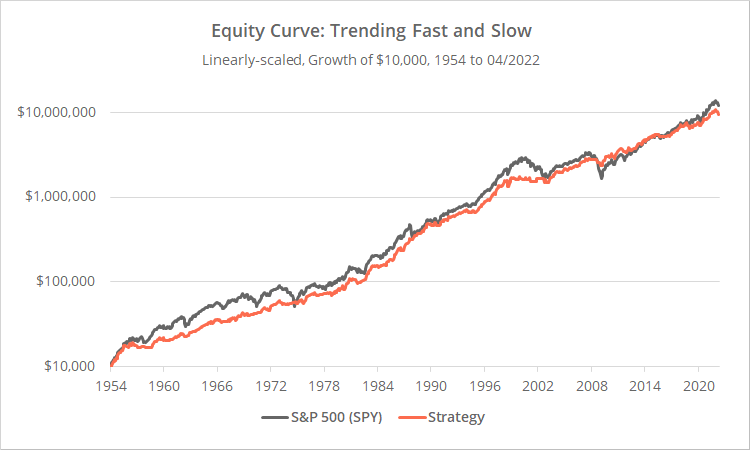
Logarithmically-scaled. Click for linearly-scaled chart.
Despite the strategy’s success managing the worst of the market’s drawdowns, we don’t plan to add it to the members area, as it has underperformed nearly all other strategies we track. We’ve still opted to talk about it here on our blog though because we think that the basic concept presented is useful, and something that strategy developers may want to consider in their design.
Strategy rules tested:
The strategy switches between fast and slow momentum based on current market volatility. If volatility is high it uses the fast momentum signal, otherwise it uses the slow signal.
- At the close on the last trading day of the month, measure the 1-month (1) volatility of the S&P 500 price index (2), based on daily data.
-
If annualized volatility is >= 17%, calculate the 1-month change in the S&P 500 price index, otherwise calculate the 12-month change.That 17% cutoff may appear to be a random figure pulled out of the air, but there’s some complexity behind it that we’ve ignored here for brevity. It’s based on a supervised machine learning technique called a “decision tree”. See the source paper for more info.
- If the change in the price index over the last n-months is positive, go long the S&P 500 (ex. SPY), otherwise move to cash. Hold position until the last trading day of the following month.
Note: In the source paper the strategy would go short rather than to cash. We did not include shorting here for two reasons. First, it has performed terribly in this specific strategy. Second, more generally, going short in the long timeframes this strategy trades just doesn’t work consistently, period (read more).
Volatility and long vs short momentum:
Most of the tactical strategies that we track employ some variation of momentum and trend-following, but they vary widely in how far to look back to measure that momentum. Lookbacks range from very long (10 to 12 months) to very short (1 to 3 months) and everything in between.
During bullish markets (when volatility is usually low), longer lookbacks tend to be more effective, because they reduce the likelihood of getting faked out by short-term dips in the market. But during bear markets and other periods of market stress (when volatility is usually high), shorter lookbacks tend to be more effective, because they react to actual changes in the underlying trend more quickly.
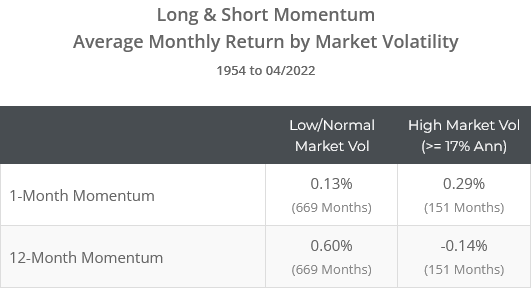
To illustrate, in the table below, we’ve shown the average long/short monthly return in SPY for both fast and slow momentum, depending on market volatility. The effect is more pronounced when considering both long and short trades, so unlike our previous test, we’ve included both. Also, unlike our previous tests, we’re ignoring transaction costs.
The stats show strong outperformance for slow momentum during low volatility markets, and vice-versa.
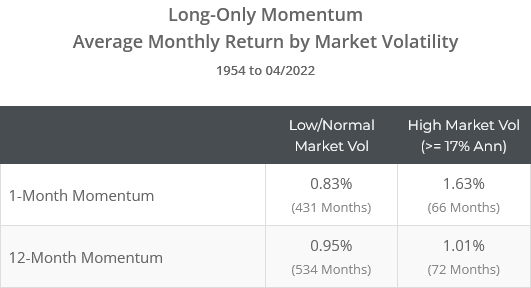
The effect is less pronounced with long-only returns (see table below), but slow momentum has the added benefit of keeping the investor in the market more often during low/normal vol markets, because it’s not getting faked out by short-term dips in the market.
Note that the 17% cutoff represents roughly the top quintile of historical observations. In other words, the majority of the time (~81%), the market is in a low/normal vol state.
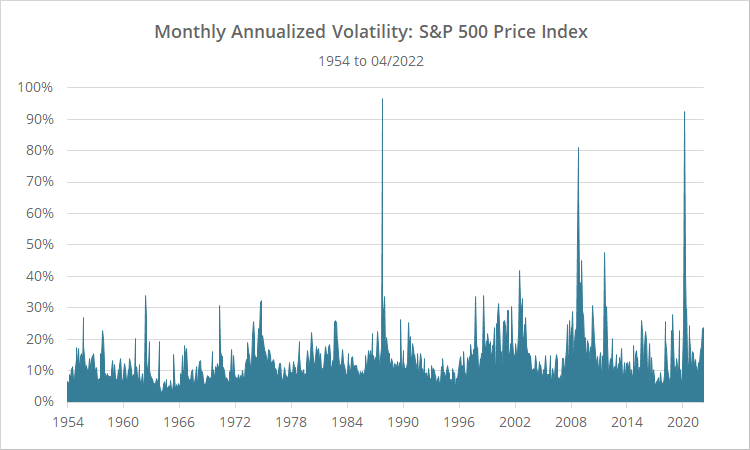
Below is the 21-day annualized volatility at the close of each month since 1954. Note how the market often stays under that 17% threshold for long periods of time before suddenly spiking up.
See the source paper for further discussion.
Our take: a useful concept in need of a better implementation:
This concept of scaling the momentum lookback based on market volatility is potentially useful, and we hope that this blog post will inspire strategy developers to think about it in their own strategy design.
Is this the best implementation of that concept? Probably not. We don’t think that was the authors’ intent; they were showing a toy example to demonstrate the idea.
Practically speaking, no one would trade a “if this month is up, go long next month” strategy, especially during a volatile market. Simplicity in strategy design is a plus, but there are limits to simplicity and that’s probably too simple by half.
New here?
We invite you to become a member for about a $1 a day, or take our platform for a test drive with a free membership. Put the industry’s best tactical asset allocation strategies to the test, combine them into your own custom portfolio, and follow them in real-time. Learn more about what we do.
* * *
End notes:
(1) The authors didn’t specify how they calculate volatility over the previous month. We’ve opted for the standard deviation of the natural log of daily percentage changes over the previous 21 trading days (the average month has about 21 trading days). To annualize that figure, we multiply the result times the square root of 252 (the average year has about 252 trading days). We were able to closely match the authors’ results and feel confident this isn’t a source of any significant discrepancy.
(2) In the source paper, the authors represent the S&P 500 with the “first generic futures index” (Bloomberg ticker: SP1). We instead use the S&P 500 price index because it allows us to extend these results much further into the past. Both indexes track each other very closely, and there was almost no difference in results between the two. Note: we only use the price index to determine the signal. All returns presented are adjusted for dividends.
