Edit 08/21/23: A follow up to this analysis was posted here.
This is a test of the “Global Growth Cycle” strategy from Grzegorz Link that uses OECD Composite Leading Indicator (CLI) data to time the market.
We’re going to present these results in an odd way. First, we’re going to replicate Grzegorz’s test, which (as he discusses) includes a degree of lookahead bias. Due to the nature of CLI data revisions, the strategy is “peeking into the future” and using data it couldn’t have known at the time. We’re then going to estimate the impact of removing that lookahead bias.
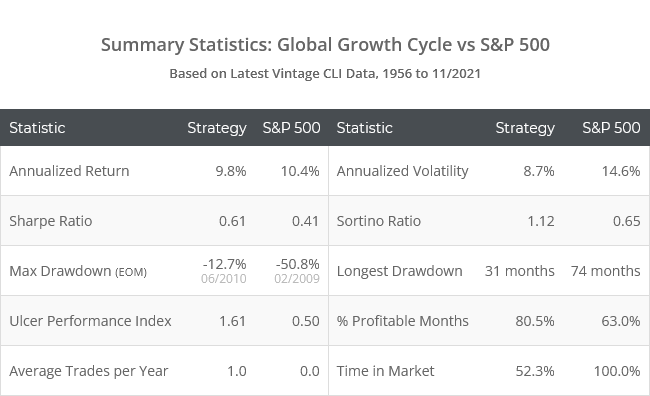
Backtested results (with lookahead bias) from 1956 follow. Note that these are not the results we show in the members area. Learn about what we do and follow 60+ asset allocation strategies like this one in near real-time.
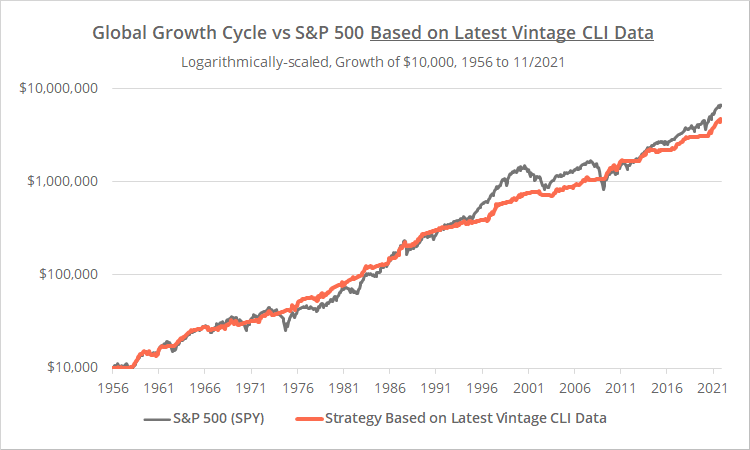
Logarithmically-scaled. Click for linearly-scaled chart.
The strategy would have produced equity-like returns over the last 60+ years, while significantly reducing drawdowns. It’s rare for a strategy that’s only based on economic data to be so successful at limiting losses.
We generally look for more “formal” publications to replicate (books, academic papers, etc.) but this strategy caught our eye because it’s employing a novel approach that’s very different from other strategies we track. Grzegorz only recently launched his site, but he’s been doing outstanding work so far and we highly recommend you follow him now.
Strategy rules tested:
OECD Composite Leading Indicator (CLI) data measures a wide range of “leading” (forward-looking) economic indicators for major world economies. A full description of the data can be found here.
CLI data for a given month is not released until shortly after month-end (see future release dates). To compensate for that, this strategy trades on the 15th calendar day of each month. That delay is overly generous, but it allows us to backtest distant data with some confidence that the CLI data would have been released prior to trade execution.
- On the 15th calendar day of each month (or first trading day thereafter), calculate a “Diffusion Index” based on CLI data at the previous month-end. The Diffusion Index measures the % of countries whose CLI value rose month-over-month. Absolute CLI values don’t matter.
- If our Diffusion Index value is >= 50%, go long SPY (S&P 500) at the close, otherwise move to cash. Hold position until the 15th calendar day (or first trading day thereafter) of the following month.
This is a very simple strategy. Any timing benefit is mostly in the strength of the CLI data itself, rather than some attempt by the strategy to massage the data.
Geek notes: (1) The author presents an alternate strategy that blends CLI data and moving average crossovers (similar to Growth-Trend Timing). We did not replicate that alternate version here. (2) The author ignores return on cash, dividends and trading frictions. We’ve included all three (learn more).
The fly in the ointment: The impact of CLI data revisions
All strategies that trade based on economic data (GTT, RPV, etc.) are prone to revisions in that data. Economic data is often initially reported at one value and then later revised. That means that a backtest based on the data as it looks today (like the one presented above) may not accurately reflect positions that would have been taken in real-time.
This is especially true for CLI data, because the entire data series since inception is affected by the addition of each new monthly data point (learn why).
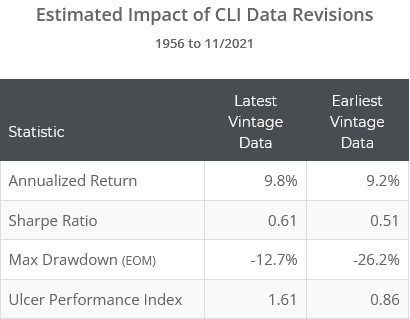
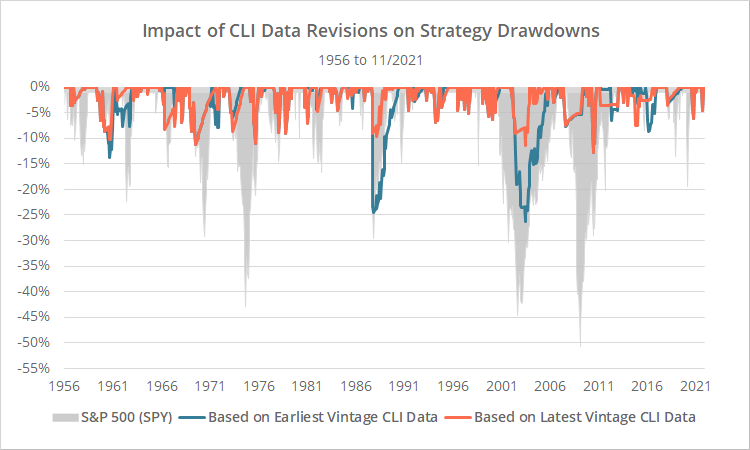
Below we’ve attempted to model how the strategy might have performed if we traded based on the CLI data at that point in time rather than the CLI data as it looks today. The orange line represents our original test, and the blue line our revised test based on the earliest CLI vintage available.
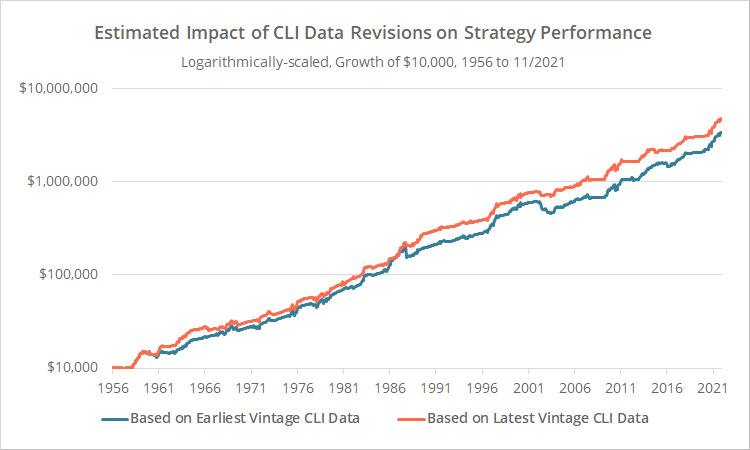
Logarithmically-scaled. Click for linearly-scaled chart.
The most obvious difference between the backtests are those big drawdowns in 1987 and 2002/03. In both cases, the meat of the difference was a discrepancy in just one single month. Such is the risk of going “all in” on a single risk asset – getting the position wrong can be nasty in the short-term.
This is an imperfect analysis for a number of reasons: (a) the OECD historical vintage data is very wonky (missing data points, etc.), (b) historical vintages are not even available prior to 2001, and (c) constituent countries have changed over time, and these results are based on current constituents that have been back-adjusted into the historical CLI data (survivorship bias).
Having said that, we think this is a truer representation of the strategy’s performance. At the very least, it demonstrates that the results of our first backtest were likely too optimistic.
All data in our members area will be based on the earliest vintage of CLI data available for that month, and will not account for any future revisions to the CLI data that would introduce lookahead bias into our analysis.
Our take on Global Growth Cycle:
Despite the painful results of our data revision analysis, we don’t think that using CLI data in this way is without value. Generally speaking, the strategy still successfully limited the worst market drawdowns and outperformed the market on a risk-adjusted basis.
Further, the novel approach taken by the strategy is quite different than others we track. Historically, it’s been most similar to Philosophical Economics’ Growth-Trend Timing, but even there, monthly correlation is a relatively low 70%.
That means that, while there may be better choices for standalone strategies, GGC may still be useful as a diversifier when included as part of an investor’s diversified Model Portfolio.
But investors beware. Even our second test that attempts to account for the impact of data revisions, has a lot of uncertainty built in due to the lack of historical vintage data, so take these strategy results with an extra healthy dose of skepticism.
We appreciate the opportunity to put Grzegorz’s strategy to the test. Grzegorz only recently launched his site, but he’s been doing outstanding work so far and we highly recommend you follow him now.
New here?
We invite you to become a member for about a $1 a day, or take our platform for a test drive with a free membership. Put the industry’s best tactical asset allocation strategies to the test, combine them into your own custom portfolio, and follow them in real-time. Learn more about what we do.
* * *
Edit 08/21/23: A follow up to this analysis was posted here.
Calculation note: Diffusion Index includes all individual countries available at that point in time, but ignores “regions” (EA19, G-7, OECD, OECDE). Click for historical OECD CLI data.
