We rarely comment on the current state of the market. The whole point of all this time we spend designing smart, agile rule-based portfolios is so that we don’t have to run around with our hair on fire when all hell breaks loose. Trading on emotion is almost always a bad idea.
Having said that, the world has been particularly scary as of late, and a look at how TAA is responding to this market may be helpful.
Average TAA allocation today across 50+ published strategies:
As we’ve shown previously, it has taken TAA about 3-months to fully de-risk and move to defensive assets during previous crises. Why not immediately? De-risk too fast and you’re vulnerable to whipsaw if the market snaps back. Too slow and you defeat the whole purpose by absorbing too much up-front loss.
Where is TAA in that de-risking process now? With such a large pool of published strategies to draw on (50+), we’re able to draw some broad conclusions. The following two charts help to show trends in the asset classes that TAA as a whole has allocated to over time.
The first chart shows the average month-end allocation to categories of assets by all of the strategies that we track. For example, “US Equities” may include everything from the S&P 500 to individual stock market sectors. Defensive assets tend to be at the bottom of the chart, and offensive at the top. The data on the far right of the chart reflects where TAA stood as of the end of February.
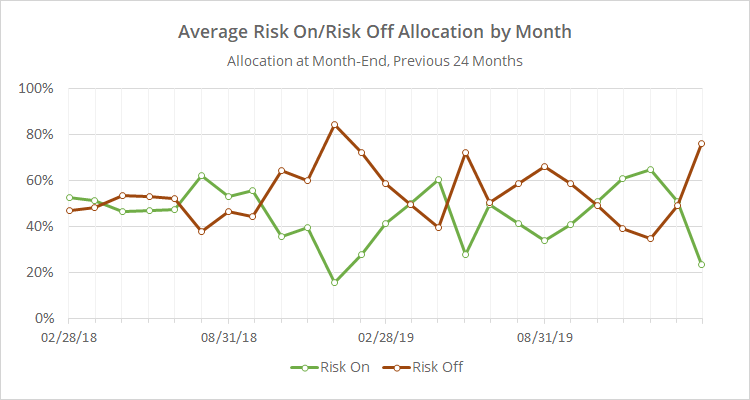
In the second chart below, we’ve combined average TAA allocation into even broader categories: “risk on” (equities, real estate and high yield bonds) versus “risk off” (everything else). We realize that some asset classes don’t fit neatly into these buckets, but it makes for a useful high-level view.
Observations:
TAA took a huge step towards reducing risk in February. Risk exposure dropped from 51% to about 24%. Most of that difference came from selling US equities and moving into US Treasuries and cash. Note: risk assets tend to be more volatile than defensive assets, so a 24% allocation in terms of dollars isn’t 24% in terms of risk.
TAA had already begun reducing exposure to risk assets back in January (but not by much). Most of that early move was shifting out of international equities.
We can consider February the second month of de-risking, but really the first significant month. Remember, the process of de-risking during past crises unfolded over about 3-months. So if history is any guide, we potentially have 1 or 2 months of additional de-risking ahead of us should this market continue to deteriorate.
TAA’s maximum exposure to defensive assets topped out at 90% during the 2007-08 GFC. It reached 84% as recently as late 2018. We’re currently at 76%, so we have a ways to go in terms of reaching maximum pessimism.
New here?
We invite you to become a member for about a $1 a day, or take our platform for a test drive with a free limited membership. Put the industry’s best tactical asset allocation strategies to the test, combine them into your own custom portfolio, and follow them in near real-time. Not a DIY investor? There’s also a managed solution. Learn more about what we do.


