This research was inspired by Alpha Architect’s coverage of a new paper looking at how the distance from a stock’s 1-year high has affected the performance of momentum strategies and the likelihood of “momentum crashes”.
We look at the same question applied to a stock index: the S&P 500. We show that how far the S&P 500 was from a 1-year high has had a significant impact on the performance of a classic long-only momentum strategy over the last 120+ years.
Defining the test:
Our baseline momentum strategy is based on the 12-month change in price (dividend-adjusted) of the S&P 500. At the close on the last trading day of the month, if the 12-month change in price is positive we go long, otherwise we move to cash. This is a classic approach used by a number of tactical strategies.
The “distance from 12-month high” at the time a position is taken is calculated as follows. We’re only considering month-end values, and the result will always be between 0 and 1:
(close – lowest close in 13 months) / (highest close in 13 months – lowest close in 13 months)
Note: “13 months” includes the current month-end and the 12 month-ends prior.
The question is: if our baseline strategy is signaling a long position, how does the distance from the 12-month high affect our performance the following month? It turns out, quite a lot.
The results:
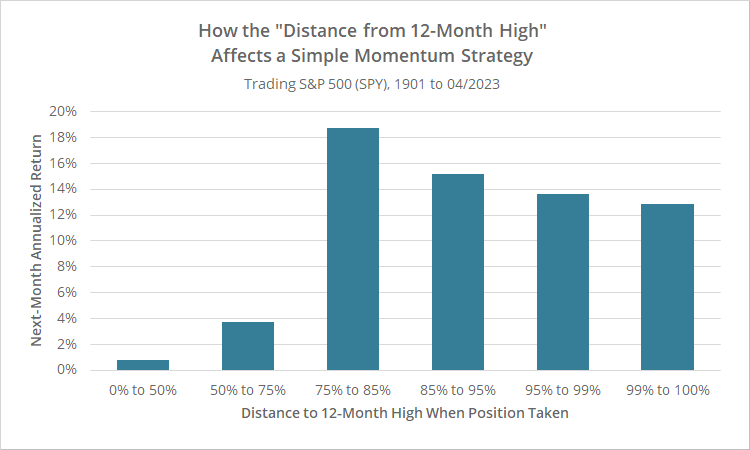
Below we’ve broken down the next month’s annualized return when our baseline strategy is signaling a long position, based on the distance (0% to 100%) from the high at the time the position is taken.
Note the drop-off in performance when the “distance from high” is less than roughly 75%.
Our “distance from high” buckets are not evenly spaced, because the market will naturally tend to be nearer to highs when our baseline strategy goes long (that is the nature of momentum).
Additional statistics:
| Performance of Simple Momentum Strategy Based on “Distance from 12-Month High” 1901 to 04/2023 |
|||
|---|---|---|---|
| Distance from 12-Month High |
Annualized Return |
Vol-Adj Annual Return |
Observations |
| 0% to 50% | 0.8% | 0.04 | 74 |
| 50% to 75% | 3.7% | 0.26 | 115 |
| 75% to 85% | 18.7% | 1.06 | 101 |
| 85% to 95% | 15.2% | 0.95 | 153 |
| 95% to 99% | 13.6% | 1.13 | 73 |
| 99% to 100% | 12.9% | 1.02 | 559 |
More than half of the observations are in that final 99% to 100% bucket, but again, performance deteriorates when the market is not within at least 75% of the high.
Turning this observation into a strategy:
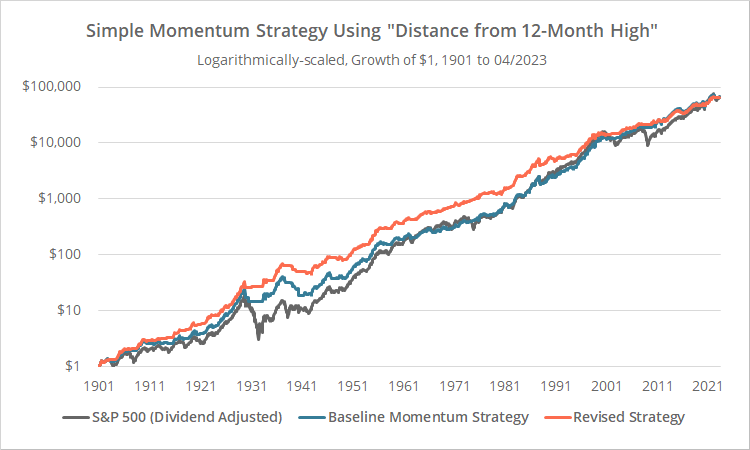
Below we’ve shown three equity curves from 1901: the S&P 500 (grey), our baseline momentum strategy (blue) and a revised momentum strategy that only takes a position at month-end when the baseline strategy goes long and the market is within 75% of its 12-month high (orange).
Note: This is a proof of concept, so unlike almost all other tests on this site, we’re ignoring transaction costs. Also, we’ve assumed a return on cash when out of the market = the 13-week US Treasuries rate.

Logarithmically-scaled. Click for linearly-scaled results.
While all 3 approaches reach almost identical levels of terminal wealth, both of our momentum strategies follow a smoother path to get there with a lot less volatility and smaller drawdowns. That should be unsurprising as that’s what momentum and trend-following are designed to do.
What might be surprising however is that our revised strategy reduced volatility and drawdowns even further, and that effect has been consistent over the last 120+ years. Below we’ve shown the rolling 5-year drawdown of our three equity curves.
Note how our revised strategy reduced max drawdowns in nearly all 5-year periods.
Not all roses:
There have been some drawbacks to this approach. Below we’ve shown the outperformance of our revised versus baseline momentum strategies since 1901.
When the line is rising, the revised strategy is outperforming the baseline strategy, and vice versa.
There was a 20+ year span of time starting in the early 1990’s when the revised strategy would have underperformed in terms of return. So, while this approach would have reduced drawdowns essentially all of the time, it would have given up some gains at times to do that.
Why this observation works:
We assume that this observation has something to do with short-term momentum (usually say, in the 3 to 6 month range).
If the market is above its price a year ago, but still far away from its 1-year high, that likely means it followed an inverted “U” shape over the last year. That means that, while long-term momentum might technically be positive, short-term momentum is negative.
In other words, there may be more straightforward ways to measure what we are measuring here.
Next steps:
To the best of our knowledge, this is the first we’ve seen anyone make this observation re: distance from 1-year highs and momentum. We found the consistency with which the observation has worked over the last 120+ years interesting, and we think it deserves to be fleshed out further.
Further research ideas include testing on other asset classes and other momentum strategies, testing on more granular daily data, and determining whether there are other, better approaches to measure what we’re measuring (i.e. by directly considering short-term momentum).
New here?
We invite you to become a member for about a $1 a day, or take our platform for a test drive with a free membership. Put the industry’s best tactical asset allocation strategies to the test, combine them into your own custom portfolio, and follow them in real-time. Learn more about what we do.
* * *
As a reader noted, this observation should actually be called the distance TO the 1-year high, not the distance FROM the 1-year high (since 100% would indicate the 1-year high and 0% the 1-year low). A semantic point, but a technically correct one.
For the geeks: We understand that we took this test in a completely different direction than the authors of the original paper. They were looking at long-short strategies in a daily timeframe with a “skip” month. We changed that to a long-only strategy in a monthly timeframe without a skip month, to better match the type of strategies we track. Our conclusions were also the opposite of the authors’. That’s not surprising. What works at the individual stock-level often works very differently at the index level (“skip months” are a good example of that).


