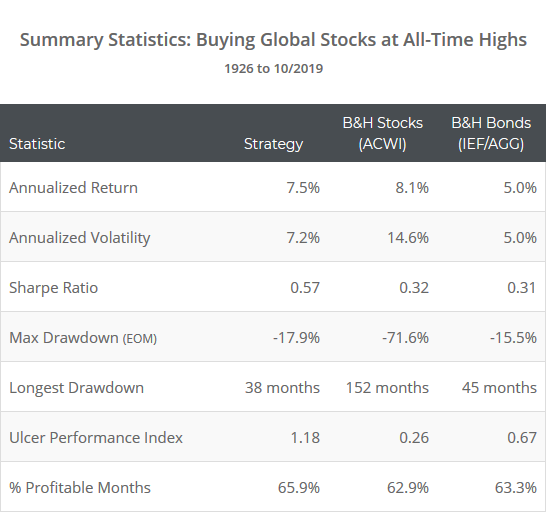
This analysis was inspired by EconomPic and Meb Faber. Here we test a simple strategy that goes long Global Stocks (ACWI) when they make a new all-time month-end high, otherwise US bonds.
The takeaway: Don’t fear buying stock (indices) when they close at all-time highs. A new high shouldn’t be your only reason for buying stocks, but it’s not in and of itself a reason to shy away.
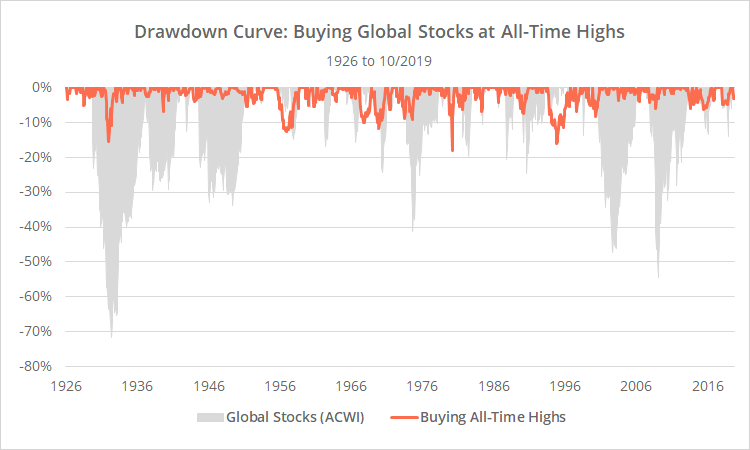
Test results net of transaction costs follow (in orange), versus buying and holding global stocks (blue) or US bonds (grey), since 1926. For 90+ years this strategy would have produced stock-like returns with tolerable bond-like drawdowns.
Learn more about what we do. Follow 50+ asset allocation strategies like this one in near real-time.

Logarithmically-scaled. Click for linearly-scaled chart.
Strategy rules tested: On the last trading day of the month, go long global stocks (ACWI) at the close if ACWI will end the day at an all-time month-end high, otherwise go long US aggregate bonds (AGG).
The strategy holds stocks less than 30% of the time, so this is really a bond strategy that selectively holds stocks when they’re showing extreme strength. The consistency with which it has outperformed a straight bond investment doesn’t necessarily imply that stocks at all-time highs is a reason to buy, but it does imply that (contrary to conventional wisdom) it isn’t a reason to shy away.
What about other flavors of stock/bond indices?
We focused on a global stock index here because that’s how the strategy was originally described. We tested a couple of narrower stock indices (like the S&P 500) and found similar behavior. Jake of EconomPic tests even more alternatives here. Note that this post is about stock indices, and isn’t relevant to individual stocks.
We assume that Jake and Meb focused on a US bond index because so much historical data is available. As mentioned, this is primarily a bond strategy that selectively holds stocks less than 30% of the time, and bonds aren’t used to determine the signal, so we would expect an analysis using any broad bond index to come to a similar conclusion.
Of course, that means that the results shown here are highly reliant on bond performance and returns could suffer during an extended period of rising interest rates.
Slightly less optimistic results:
Our results are slightly less optimistic than those presented by Jake and Meb. That’s mostly due to the addition of basic cost assumptions, and differences in data sources (see end notes). Importantly though: Despite those stricter assumptions, we still come to the exact same conclusion.
A big thank you to Jake and Meb for sharing. Both of these gentlemen are legends in the world of asset allocation, and we highly recommend you follow them now.
New here?
We invite you to become a member for about a $1 a day, or take our platform for a test drive with a free limited membership. Put the industry’s best tactical asset allocation strategies to the test, combine them into your own custom portfolio, and then track them in near real-time. Have questions? Learn more about what we do, check out our FAQs or contact us.
End notes:
- For ACWI global stock data prior to 1970 we used data sourced from GFD. GFD returns are based on gross rather than net index returns (of foreign taxes paid). This is an important distinction for indices with an international component, like ACWI. That means that ACWI returns prior to 1970 (for both the strategy and buy and hold) are a little rich.
- For AGG US aggregate bond data prior to 1968, we used intermediate US Treasuries (IEF) due to a lack of quality aggregate bond data.
- For all synthetic data prior to the launch of the respective ETF, we apply an expense ratio to the synthetic data equal to that of the ETF. Learn more about these and other backtest assumptions.


