This is a test of the “Classical Asset Allocation” strategy from the paper Momentum and Markowitz: A Golden Combination, authored by three of our favorite minds in tactical asset allocation: Dr. Wouter Keller, Adam Butler of GestaltU/ReSolve AM, and Ilya Kipnis from the blog QuantStrat TradeR. This TAA model employs Markowitz’s classic mean-variance optimization, coupled with a short lookback in order to harvest the momentum factor (I realize that’s a mouthful, more on this in a moment).
Results from 1971, net of transaction costs, follow for two variations of the strategy: Offensive (orange) and Defensive (blue). Read more about our backtests or let AllocateSmartly help you follow this strategy in near real-time.

Linearly-scaled. Click for logarithmically-scaled chart.
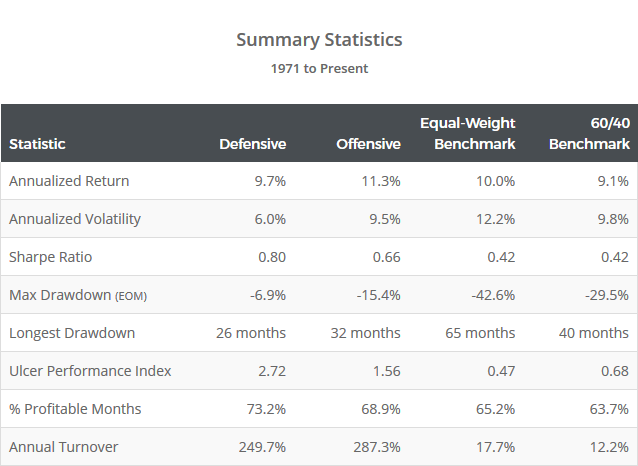
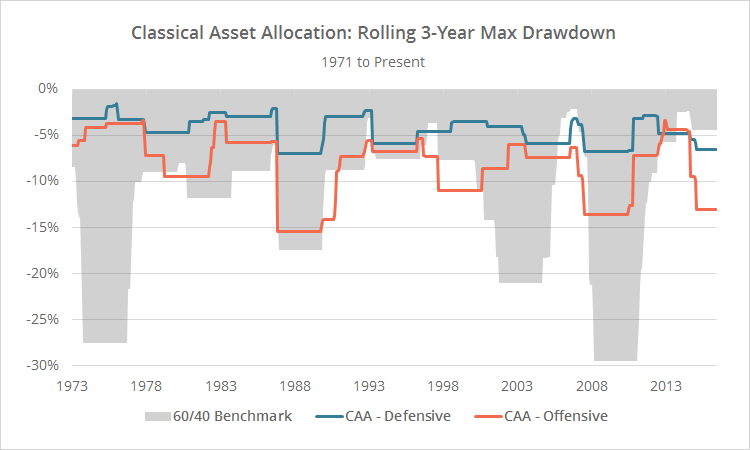
As the statistics below make clear, the primary advantage of the Classical Asset Allocation strategy hasn’t been generating outsized returns, but rather, in improving return relative to volatility and drawdowns. Experienced investors who have paid their dues in the trenches know that it’s month-to-month volatility and drawdowns that cause investors to abandon the best laid plans (usually at the worst possible moment). In the real world, there’s as much value in managing risk as there is in pursuing return.
Mean-Variance Optimization: Great in Theory, Bad in Practice?
For the uninitiated, Harry Markowitz’s Mean-Variance Optimization (MVO) (aka “Modern Portfolio Theory”, aka “The Efficient Frontier”) forms part of the foundation of modern finance. It’s a quantitative approach to allocating to a portfolio of assets, in order to maximize return for a given level of risk. The core concept underlying MVO is that an asset’s risk and return cannot be assessed in isolation, but rather, by how it contributes to the portfolio’s overall risk and return.
In practice however, MVO often fails to deliver. The authors discuss multiple reasons for that in their paper, but the most important takeaway is that, traditionally, investors use too long of a lookback when calculating MVO inputs. MVO requires two pieces of information for all assets: expected return and a covariance matrix. Investors often use three or five year average returns in order to forecast future returns, but historically, returns are mean-reverting over that timeframe. That means that MVO is overweighting assets likely to underperform, and underweighting assets likely to outperform.
To combat this, the authors shorten the lookbacks used to calculate expected return to a momentum-friendly period between 1 and 12 months. Note that the authors’ observation was the inspiration for our own test of a Max Sharpe strategy.
MVO is usually performed using a quadratic optimizer (as we did in our test of popular portfolio optimization techniques). The paper’s authors took an alternative approach, instead using Markowitz’s “Critical Line Algorithm”. More on this in a moment.
Strategy rules tested:
- At the close on the final trading day of each month, calculate expected return and a covariance matrix for all asset classes traded. We’ve tested the paper’s N=8 universe: US equities (represented by SPY), US tech (QQQ), international equities (EFA), emerging market equities (EEM), Japan equities (EWJ), US high-yield bonds (HYG), intermediate-term US Treasuries (IEF) and US T-Bills (BIL).
- Expected return for each asset class is calculated by measuring returns over the previous 1, 3, 6, and 12 months, summing the results, and dividing by 22. This is the same approach employed by Keller and Butler’s Elastic Asset Allocation strategy, and is designed to measure momentum over multiple momentum-friendly lookbacks from 1 to 12 months.
- The covariance matrix is calculated based on the previous year using month-end data.
- Determine the optimal portfolio allocation using Markowitz’s “Critical Line Algorithm”:
- Long-only, without leverage.
- All assets are capped at 25% of the portfolio, except for the two defensive assets, int-term US Treasuries (IEF) and US T-Bills (BIL), which are uncapped.
- Determine the optimal portfolio allocation for a given target volatility level: 5% for the “defensive” variation of the strategy, or 10% for the “offensive” version.
- All trades are executed at the close. Trades in BIL are assumed to be placed in cash. Hold positions until the final trading day of the following month. Rebalance the entire portfolio monthly, regardless of whether there is a change in position.
Markowitz’s Critical Line Algorithm
 Markowitz’s Critical Line Algorithm (CLA) is an alternative to the traditional approach of using a quadratic optimizer to perform mean-variance optimization. The calculations involved in CLA are beyond the scope of this article, but for those interested in learning more, I highly recommend checking out Ilya Kipnis’ implementation in R included in the appendix of the source paper. Anyone familiar with Ilya’s work on his blog QuantStrat TradeR knows that he’s a maestro when it comes to expressing complex ideas in R, and this code is a masterwork (and blazingly fast). If you are at all interested in quantitative finance, and doubly so if you code in R, Ilya’s blog is a must follow.
Other implementations of the Critical Line Algorithm include Clarence Kwan’s implementation in Excel and Bailey and de Prado’s implementation in Python.
Offensive vs Defensive Variations
The only difference between the offensive and defensive versions of this model is the target volatility level used in determining the optimal portfolio: 5% for the defensive variation of the strategy, and 10% for the offensive variation. In other words, each month the strategy attempts to ensure that annualized portfolio volatility will remain below that level.
For comparison, the 60/40 benchmark exhibited annualized volatility of approximately 9.8% over this test, putting the offensive variation somewhere in the neighborhood of the 60/40, and the defensive variation much less.
During periods of particularly low volatility (like we find ourselves in right now), the strategy may be able to stay under those volatility targets using purely risk assets (i.e. everything other than IEF and cash), but in most instances, the strategy must add some degree of lower volatility defensive assets.
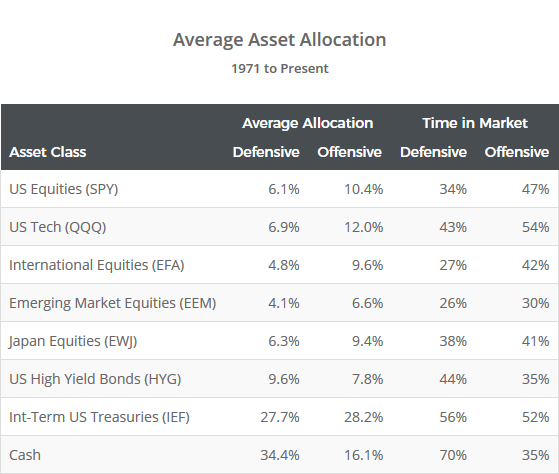
To illustrate, the table below shows the average allocation to each asset, and the percentage of months where allocation > 0%. Note the defensive variation’s reduced allocation to risk assets, and greatly increased allocation to cash, which it uses to throttle volatility.
Also note that the nature of MVO causes this strategy to allocate to cash in place of longer duration IEF when IEF is underperforming. This should provide useful in an era of rising interest rates (read more and more).
I think that there’s a lot of good in this strategy, including a more all-encompassing approach to measuring momentum, the consideration of asset covariance in determining allocation (which tends to be much more predictable than return), and the use of volatility targeting to better manage portfolio volatility. There are always opportunities to tweak the model, but I think that the core components of a wise tactical asset allocation approach are included.
Thank you to all of the strategy authors: Dr. Wouter Keller, Adam Butler of GestaltU/ReSolve AM, and Ilya Kipnis from the blog QuantStrat TradeR for their fine work and the opportunity to put this strategy to the test.
We invite you to become a member for less than $1 a day, or take our platform for a test drive with a free limited membership. Members can track the industry’s best tactical asset allocation strategies in near real-time, and combine them into custom portfolios. Have questions? Learn more about what we do, check out our FAQs or contact us.
Calculation note: These results do not include emerging market equities exposure (EEM) prior to 1989 due to a lack of accurate asset data.


