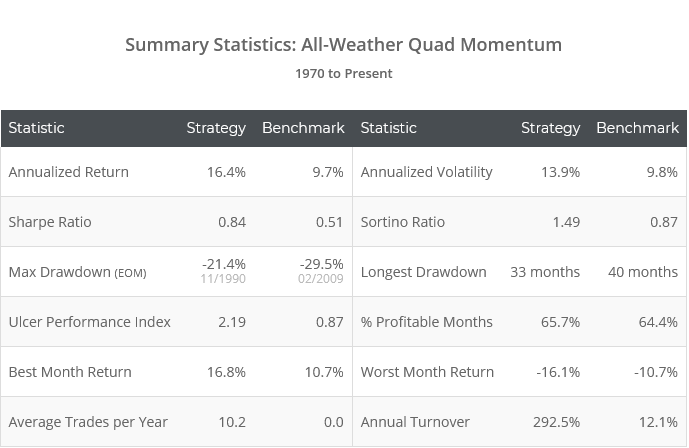
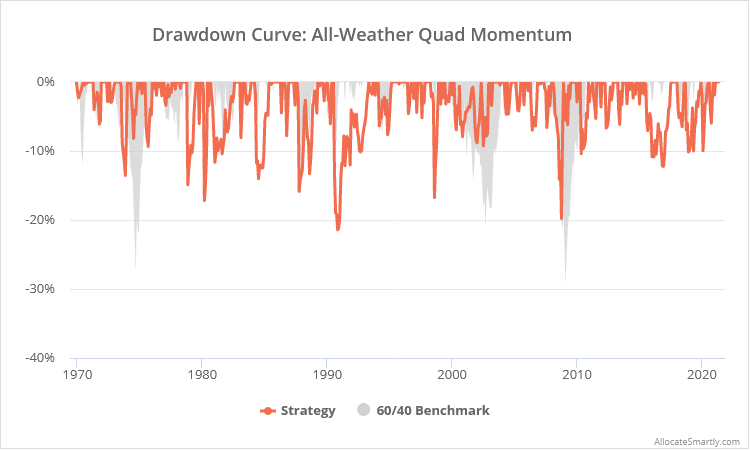
This is an independent test of the tactical strategy “All-Weather Quad Momentum” (AWQM) from Todd Tresidder of FinancialMentor.com. Many of our members came to us from Financial Mentor, so it’s fitting that we add a strategy to our platform that demonstrates his approach to asset allocation.
Backtested results from 1970 follow. Results are net of transaction costs (see backtest assumptions). Learn more about what we do and follow AWQM and 60+ other asset allocation strategies in near real-time.

Logarithmically-scaled. Click for linearly-scaled chart.
About this strategy:
Like most tactical asset allocation strategies, AWQM trades once per month. The portfolio is split evenly between a long and short-term momentum component.
We generally think of long-term momentum as momentum over the last 10-12 months, and short-term over the last 1-6 months. Those may seem like one in the same, and they generally are when the market is in the midst of a long sustained trend, but they’ll often produce very different results during periods of market stress (like we saw last year with the Covid pullback).
In recent decades, short-term momentum has generally been the more effective, but Financial Mentor sees that as a temporary state driven by an activist Fed. As the effectiveness of Fed intervention wanes, markets will eventually return to a healthier state where long-term momentum prevails. The precise timing of that shift is impossible to predict and will likely come abruptly without warning, so the portfolio is split evenly between the two.
As the test results show, AWQM has posted big returns, but a word of common sense: this strategy takes aggressive positions. It will at times be entirely allocated to risk, and does not enforce a meaningful degree of diversification. Investors not comfortable with that level of risk should strongly consider mixing AWQM with other asset allocation strategies to better diversify short-term risk. That’s something out platform was specifically built to tackle.
Unlike most strategies that we track, we will not be disclosing the specific rules traded by AWQM. Financial Mentor asked us to independently verify and track their results, and in exchange our members can follow along with the strategy like any other on our platform.
To be clear, we know the rules, and the data on our platform is based on our own independent analysis using the same rigorous approach you’ve come to expect from us.
Conceptually, you can think of AWQM as a blend of “Traditional Dual Momentum” for the long-term component (member link), and “Accelerating Dual Momentum” for the short-term component (member link | public link), but with a broader set of asset classes to choose from.
Like the well-known “Permanent” and “All-Weather” portfolios, that broader set of asset classes is meant to succeed in all four potential economic conditions: prosperity (equities and risk assets), recession (cash and short-term treasuries), inflation (gold and TIPS) and deflation (long-term treasuries). Unlike those portfolios however, which have exposure to all assets at all times, AWQM is attempting to tactically switch to the one or two best suited to the current economic situation.
The importance of common sense (as long as it’s empirically grounded):
Here’s our headline takeaway from our experience working with Financial Mentor: They understand that the wrong way to develop a tactical asset allocation strategy (or any strategy for that matter) is to simply figure out what’s worked best in the past.
The problem with that is that the past doesn’t repeat, it only rhymes. We should use the past as a starting point, but then adjust those observations to maximize future performance (i.e. the only performance that actually matters). We can do that in two ways:
- Apply common sense to determine when the future will be predictably different from the past. By its nature, this may not be historically optimal.
- Acknowledge that there’s much we can’t know about the future, so when in doubt, hedge our bets.
There are multiple examples I could cite to “improve” the historical performance of AWQM, but the author made those design decisions based on expectations of how the future will differ from the past.
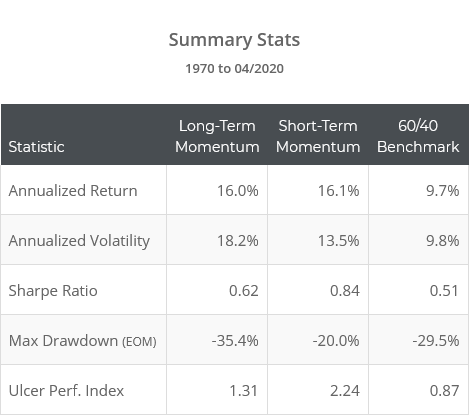
Let’s use the aforementioned short vs long-term momentum as an example. In the following table, we show summary stats for the short and long-term momentum components if traded alone.
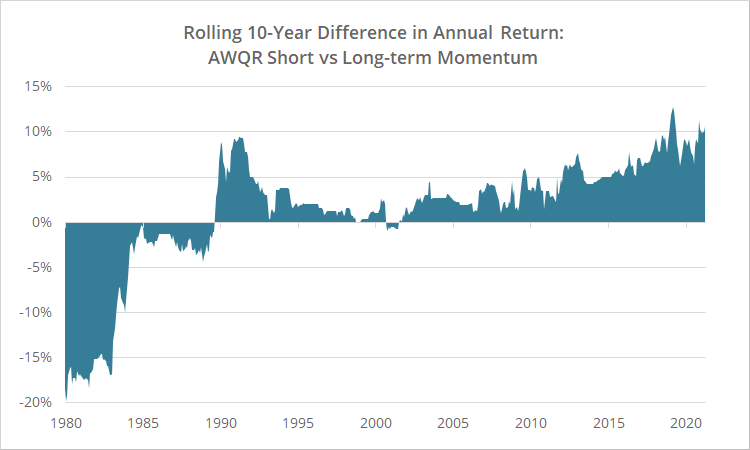
And in the following chart, we show the rolling 10-year difference in annual returns between the short and long-term momentum components. Positive values indicate short-term momentum outperformed long (and vice-versa):
Both short and long-term momentum have been effective, but the optimal approach has been to tilt heavily towards short-term momentum. The sweet spot that would have maximized historical performance has been about 75% short-term/25% long-term. The authors opted not to do that though because of their intuition about how the future will differ from the past.
Now, we may not agree with that intuition. Maybe we think that shift to short-term momentum is the result of markets becoming “faster”, and may even continue to shorten in future decades. But therein should lie the real challenge of developing a trading strategy.
People get too focused on backtesting the best strategy, but that’s the easy part. We’re all pulling from the same historical data. Anybody can run a million iterations of a strategy to find the perfectly optimized mix of assets and parameters that has outperformed in the past. There’s no challenge in that. The challenge is knowing when to deviate from that historically optimal approach to maximize our chances at future success.
As long-time readers know, this aligns with our own approach to investing. Some examples of “historically suboptimal common sense” in our own work:
- Combining strategies into Model Portfolios reduces exposure to any one strategy going off the rails in the future, but often would have underperformed (historically) going all in on one or two strategies.
- Bonds face stiff headwinds in the coming years and are likely to underperform historical norms. We account for that differently with TAA vs buy & hold, but both deviate from what’s worked best in the past. Learn more.
- Most tactical strategies trade once per month, and most have performed best when traded on the last day of the month. That may not be the case in the future, so we support “tranching” strategies across the month. Learn more.
- Our own Meta Strategy is by its nature a demonstration of the bullet points above. We also “walk our test forward”, rather than just selecting the optimal mix of strategies today and applying them retroactively. That would show much higher historical performance, but would say much less about future performance. Learn more.
In short, build for the future not the past.
Highest exposure to USD risk – Does that matter?
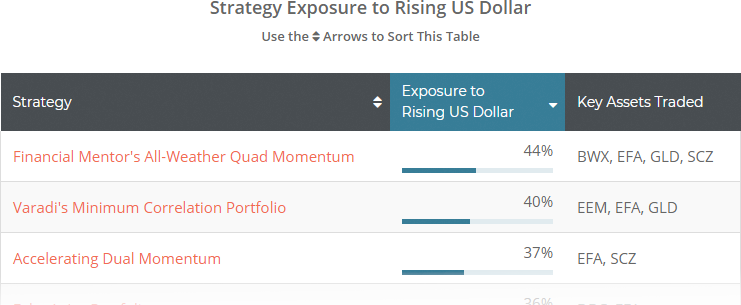
When we write a blog post describing a new strategy, we try to highlight at least one data point that makes the strategy unique from others we track. Here’s one for AWQM: it has the highest exposure to USD risk out of all 60+ strategies that we track. What does that mean in practical terms?
One of the myriad analyses we provide is each strategy’s exposure to a Rising US Dollar. Asset classes such as gold and commodities, and international ETFs that are denominated in currencies other than USD, tend to have an inverse relationship with USD. Strategies with a lot of exposure to those asset classes, especially when they lack an effective mechanism to selectively reduce that exposure, are more likely to underperform when the dollar rises, and outperform when it falls.
The report has always been a bit of an oddball on our platform, because the practical significance isn’t clear cut. That’s different than say exposure to rising interest rates (which we also model for members). Given where we stand at the tail end of a multi-decade decline in rates, high exposure to rising rates is inherently bad. But the future of the dollar is less clear.
If you believe that a future of fed intervention, inflation and a weakening dollar is the more significant long-term risk (as I think Financial Mentor would argue), then AWQM is well positioned to capitalize on that future.
More on Financial Mentor (overwhelmed investors read this):
Financial Mentor is helmed by Todd Tresidder. Todd has written an entire educational series on his site describing his approach to using our platform, including how he selects strategies and builds Model Portfolios.
In terms of our communication style, Todd is sort of the yin to our yang. If you haven’t noticed, we are geeks. We write like geeks. We present data like geeks. It’s in our nature. We think our fanatical attention to the minutiae makes for better analysis, but for the uninitiated it can all be a bit overwhelming. Todd does a much better job than we do describing our platform in terms that the less geeky investor can understand.
If you find yourself overwhelmed by our platform, we highly recommend visiting FinancialMentor.com and taking his educational series for a spin.
New here?
We invite you to become a member for about a $1 a day, or take our platform for a test drive with a free limited membership. Put the industry’s best tactical asset allocation strategies to the test, combine them into your own custom portfolio, and follow them in near real-time. Not a DIY investor? There’s also a managed solution. Learn more about what we do.
Calculation note: All results are as of late May, so you will find some minute deviations from the updated results in the members area. This post was mostly completed then but the author’s bouncing baby girl came a little earlier than expected so we put it on ice for a couple of weeks.
