This is an independent test of Optimum3, a tactical asset allocation strategy from Todd Tresidder of FinancialMentor.com. Optimum3 starts as a momentum strategy similar to many of the TAA strategies we track. It combines that with a unique approach to portfolio optimization to enforce a degree of “high momentum diversification”.
Backtested results from 1987 follow. Results are net of transaction costs – see backtest assumptions. Learn about what we do and follow 60+ asset allocation strategies like this one in near real-time.

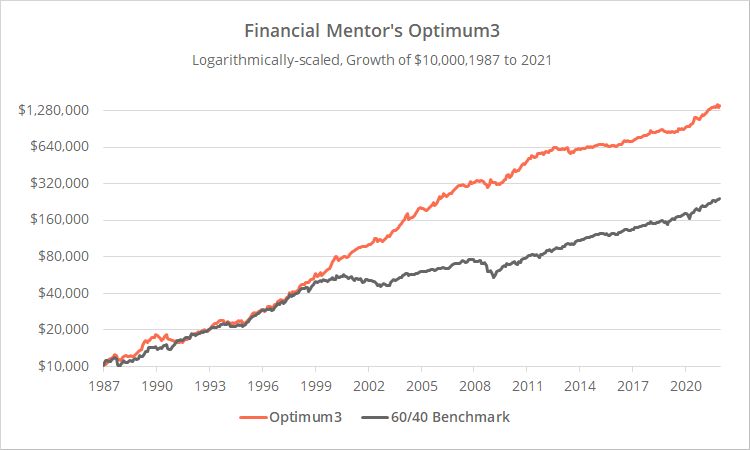
Logarithmically-scaled. Click for linearly-scaled chart.
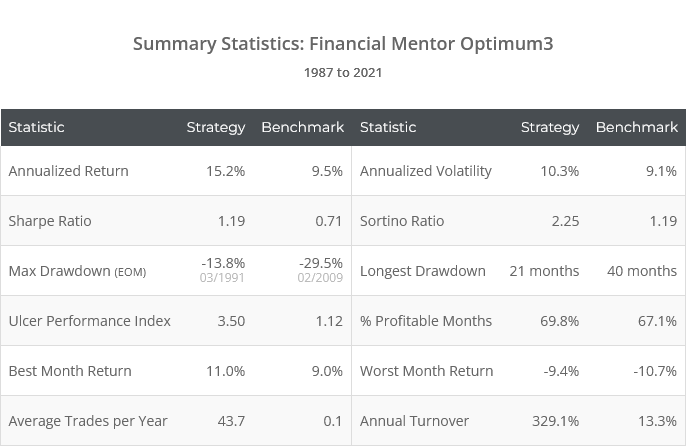
Optimum3 would have significantly outperformed the broader market, while limiting major drawdowns and maintaining portfolio volatility roughly inline with a diversified B&H portfolio.
Optimum3 is one of the handful of strategies we track for which we are unable to disclose the specific rules. Financial Mentor asked us to independently verify their results, and in exchange our members can follow along with the strategy like any other on our platform.
To be clear, we know the rules, and the data on our platform is based on our own independent replication of the strategy using the same rigorous approach you’ve come to expect from us.
Having said that, we are able to say enough about Optimum3 to give a general idea of what makes it a unique strategy that is unlike others that we track.
About this strategy – the standard part:
Optimum3 starts as a run-of-the-mill monthly momentum strategy. On the last trading day of each month, it considers a broad universe of 15 global asset classes (see end notes for a complete list) and selects roughly the top half that have exhibited the strongest momentum.
The strategy uses what’s called “dual momentum”, meaning assets must exhibit both positive momentum (this is essentially trend-following) and strong momentum relative to its peers (aka “relative” or “cross-sectional” momentum).
That’s all pretty standard fare and that simple approach has been effective historically. Think Faber’s GTAA Aggressive or Livingston’s Papa Bear. It’s in the next step where Optimum3 differentiates itself.
About this strategy – the novel part:
As one would expect, assets with stronger momentum tend to outperform assets with weaker momentum. Here’s a simple toy example (not how the strategy actually trades).
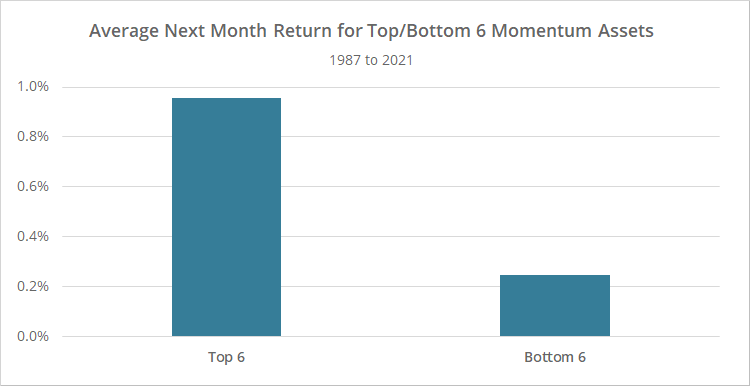
Start with the same 15 asset classes traded by Optimum3. At the end of each month, buy either the 6 assets with the highest 6-month return, or the 6 with the lowest 6-month return. In the graph below, we show the average return over the following month for each group. Note: this is a proof of concept, so we’ve ignored transaction costs.
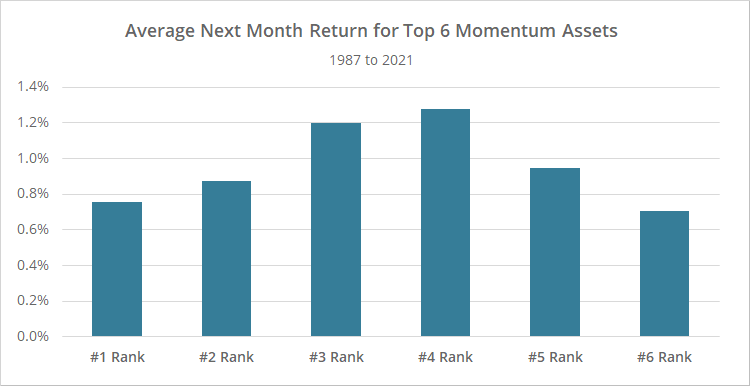
Obviously, our top 6 assets have outperformed by a considerable margin. Next, let’s look within those top 6 assets, and compare buying the #1 asset, #2 asset, etc.
Returns are broadly positive, but inconsistently. Not only is the #1 ranked asset not necessarily better than #2, it’s not even necessarily better than #6. With other more “sophisticated” measures of momentum, there may be some marginal benefit of #1 versus #2, but even then the difference is likely small.
Momentum is a hammer, not a scalpel, and getting overly worked up about selecting the asset with the absolute tippity-top momentum is usually a waste of effort (and generates unnecessary costs, taxable sales, etc.)
So Optimum3 takes a different approach.
It starts with its list of “top half” assets and asks: What’s the most robust portfolio of 3 assets one could make from this list? It defines “robust” as the 3 assets with the lowest average correlation to the other remaining assets in the portfolio (akin to Varadi’s Minimum Correlation algorithm). All other assets are discarded.
The advantage of this approach is two-fold:
First, it respects the observation we demonstrated earlier in our toy example: no asset within our top momentum group is significantly better than any other.
Second, it enforces a degree of diversification on the portfolio, but in a way that is still limited to high momentum assets.
The problem with conventional “relative” momentum strategies like Faber’s GTAA Aggressive is that they will often take extremely concentrated positions (ex. 100% equities), because risk as a whole happens to be in or out of fashion at the moment. Concentrated positions are great when things are going as planned, but terrible when the market turns against you.
Optimum3 is enforcing a level of diversification, but doing so with assets that are exhibiting positive momentum, and tailored to “play well together” to maximize diversification in this specific situation.
We’ve skipped over some strategy details, but the core concept described here is the meat of the strategy. It’s a simple concept, but also one that’s unique in the lineup of 60+ strategies we track. It feels a little like one of those ah-ha ideas that’s obvious in hindsight.
Other considerations:
Our job is to take an adversarial approach to strategy analysis, so we never test a strategy without highlighting potential negatives to consider.
First, because Optimum3 relies on daily data (as opposed to monthly) this test is shorter than many strategies we track. All things being equal, longer tests are better because they show how the strategy has performed through a broader range of market conditions.
And second, Optimum3 is much more tax in-efficient than most strategies we track, with just 36% of backtested returns coming from long-term capital gains or dividends (members: see the Tax Analysis page). That may or may not be significant depending on the type of account traded.
Most momentum strategies are reasonably tax efficient because, by their nature, momentum strategies “let winners run”. That means the most profitable positions tend to be held longer and are more likely to qualify as long-term capital gains (learn more).
In the case of Optimum3, it’s swapping positions for reasons entirely unrelated to momentum. A winner may be cut short because some other unrelated asset dropped out of the portfolio, requiring the entire portfolio to be reworked.
Our take on Optimum3:
Optimum3 has performed well historically. At a conceptual level, we really like both the logic and simplicity of the strategy. It aligns well with our own thinking about momentum and tactical trading. We expect this to be a popular addition to our platform.
Of course, as always, common sense prevails. This is just one strategy, and no matter how well it has performed, we’re still proponents of combining multiple strategies and strategic concepts to protect against any one of them going off the rails (a task our platform was specifically built to tackle).
We appreciate the opportunity to put Financial Mentor’s strategy to the test. Financial Mentor is helmed by Todd Tresidder. Todd has written an entire educational series on his site describing his approach to using our platform, including how he selects strategies and builds Model Portfolios.
In terms of communication style, Todd is sort of the yin to our yang. If you haven’t noticed, we are geeks. We write like geeks. We present data like geeks. It’s in our nature. We think our fanatical attention to the minutiae makes for better analysis, but for the uninitiated it can all be a bit overwhelming. Todd does a much better job than we do describing our platform in terms that the less geeky investor can understand.
If you find yourself overwhelmed by our platform, we highly recommend visiting FinancialMentor.com and taking his educational series for a spin.
New here?
We invite you to become a member for about a $1 a day, or take our platform for a test drive with a free membership. Put the industry’s best tactical asset allocation strategies to the test, combine them into your own custom portfolio, and follow them in real-time. Learn more about what we do.
* * *
Asset classes traded by Optimum3:
S&P 500 (represented by SPY), Nasdaq 100 (QQQ), US real estate (VNQ), US mortgage real estate (REM), intermediate-term US Treasuries (IEF), long-term US Treasuries (TLT), US TIPS (TIP), Europe stocks (VGK), Japan stocks (EWJ), international small cap stocks (SCZ), emerging market stocks (EEM), international real estate (RWX), international treasuries (BWX), commodities (DBC) and gold (GLD).


